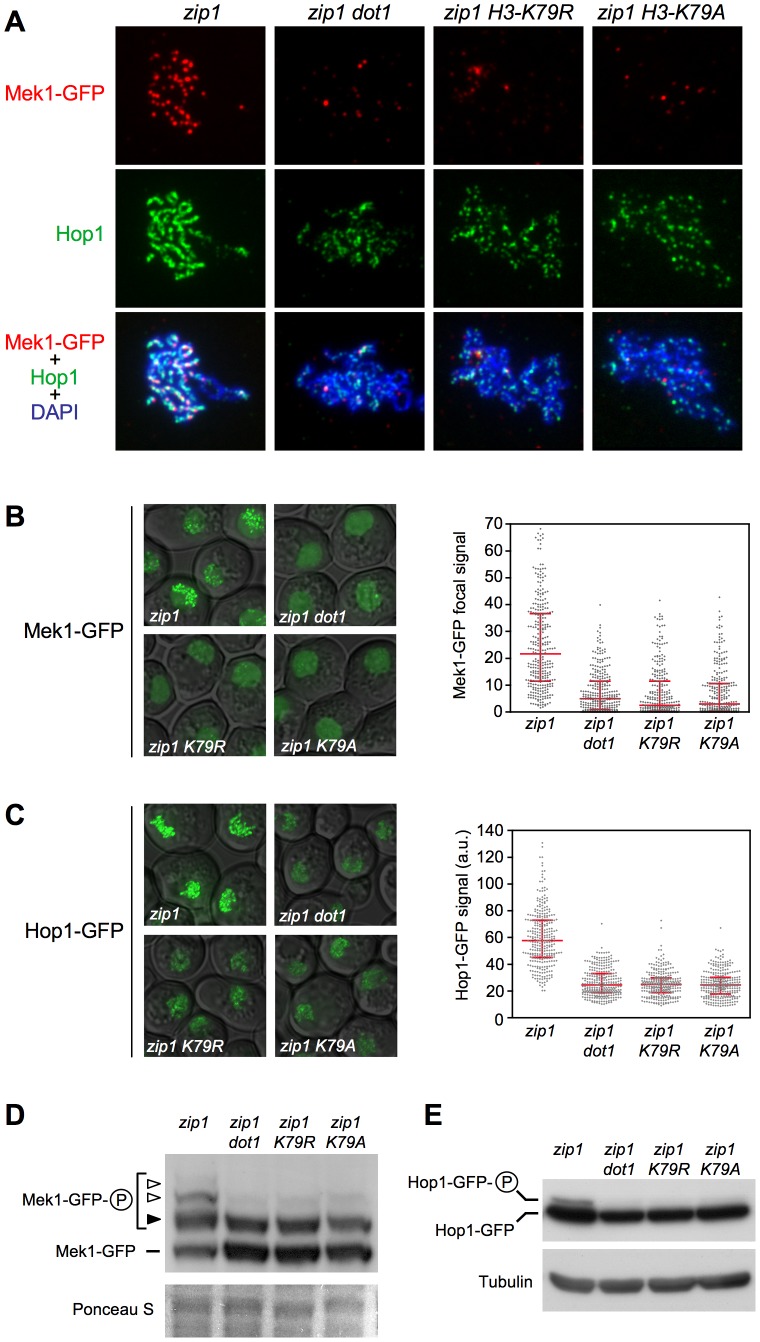
Figure 6. The H3-K79R and H3-K79A mutations recapitulate dot1 defects in checkpoint-induced Mek1 and Hop1 phosphorylation and localization.
(A) Immunofluorescence of meiotic chromosome spreads stained with DAPI (blue), anti-Hop1 (green) and anti-GFP (red) antibodies. Representative nuclei are shown. The same exposure time was used to capture the signal from the different strains. (B) and (C) Representative images of meiotic cells expressing MEK1-GFP and HOP1-GFP, respectively. The scattered plots represent the quantification of the Mek1-GFP focal signal (B) and total Hop1-GFP signal intensity (C) on fluorescence images (a.u., arbitrary units). Error bars represent the median with interquartile range. 300 individual nuclei were analyzed for each strain. (D) Western blot analysis of zip1-induced Mek1-GFP phosphorylation in a Phos-tag gel using anti-Mek1 antibodies. The basal Mek1-GFP form (line), and the forms resulting from Mec1/Tel1-dependent phosphorylation (black arrowhead) and autophosphorylation (white arrowheads) are indicated. Ponceau S staining of the membrane is shown as a loading control. (E) Western blot analysis of zip1-induced Hop1-GFP phosphorylation using anti-GFP antibodies. Tubulin is shown as a loading control. Strains in (A), (B) and (D) are: DP1046 (zip1), DP1049 (zip1 dot1), DP1048 (zip1 H3-K79R) and DP1047 (zip1 H3-K79A). Strains in (C) and (E) are: DP1042 (zip1), DP1045 (zip1 dot1), DP1044 (zip1 H3-K79R) and DP1043 (zip1 H3-K79A). In all cases (A–E), spreads were made, GFP images were captured and cell extracts were prepared after 24 h of meiotic induction in ndt80 strains.

