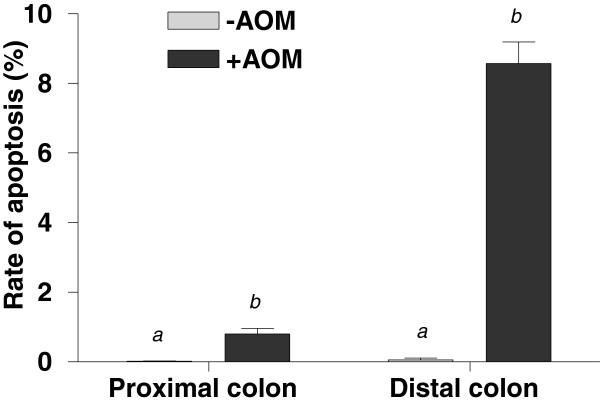
Figure 6.
Apoptotic indices (% apoptotic cells per crypt height) of the proximal and distal colonic epithelium of rats 6 h after injection with saline (−AOM) and AOM (+AOM) as determined by morphological assessment of the colonic mucosa. Data are mean±SEM (n=20). Means within the same colonic section with different superscripts are significantly different (P<0.0001).

