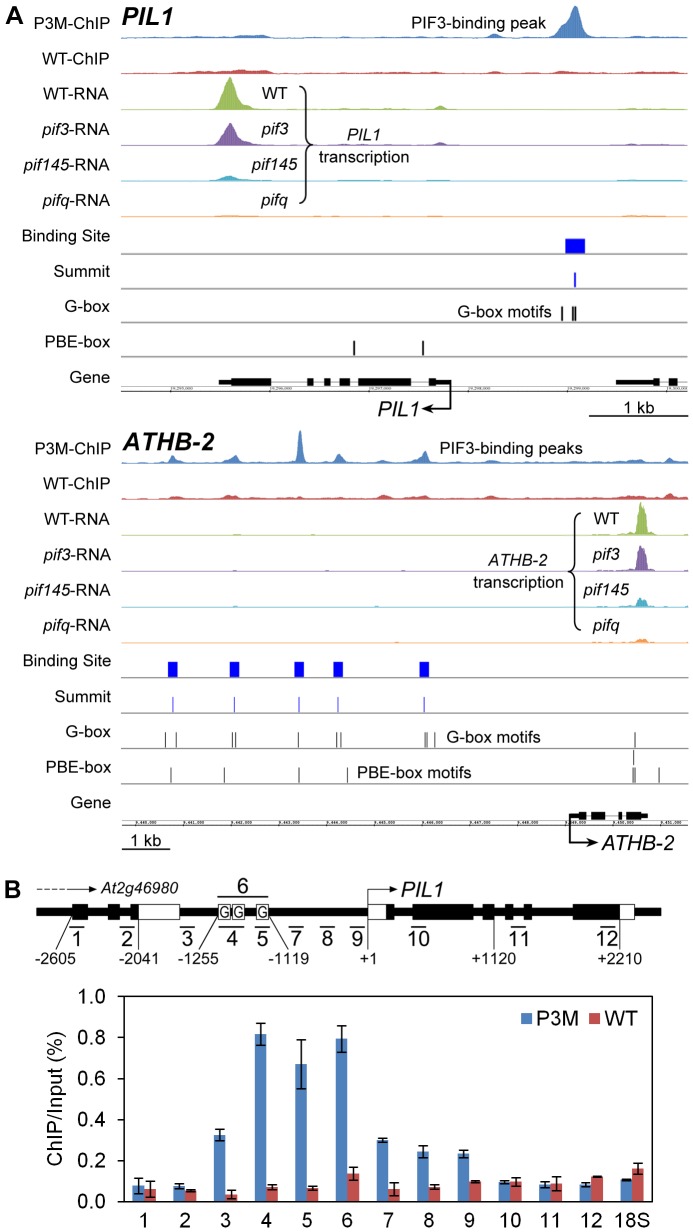
Figure 2. Compiled ChIP–seq and RNA–seq data identify PIL1 and ATHB2 as direct targets of PIF3 transcriptional regulation.
(A) Visualization of ChIP-seq and RNA-seq data in the genomic regions encompassing two representative genes, PIL1 and ATHB-2. The ChIP and RNA tracks show the pile-up distribution of the combined raw reads from four biological replicates of ChIP-seq data and three replicates of RNA-seq data, respectively. P3M- and WT-ChIP: DNA immunoprecipitated from PIF3-Myc-expressing and from wild-type seedlings, respectively. WT-, pif3-, pif145- and pifq-RNA: RNA from genotypes used for expression analysis. Binding Site: 201 bp defined as the PIF3-binding site. Summit: predicted PIF3-binding center defined from the binding-peak maximum. G- and PBE-box: Vertical lines indicate motif positions. (B) ChIP-qPCR verification of specific PIF3 binding to the G-box-located promoter region of PIL1. The schematic diagram illustrates the genomic region around the PIL1 locus. The short bars with numbers show 12 specific qPCR products. The black and white rectangular boxes represent CDS and UTR, respectively. Boxes labeled ‘G’ indicate the approximate locations of three G-box motifs in the PIL1 promoter. The relative enrichment level is represented by the percentage of co-immunoprecipitated DNA to the input control in the P3M and WT samples. Data are represented as the mean of biological triplicates +/− SEM. 18S: 18S rRNA as internal control.

