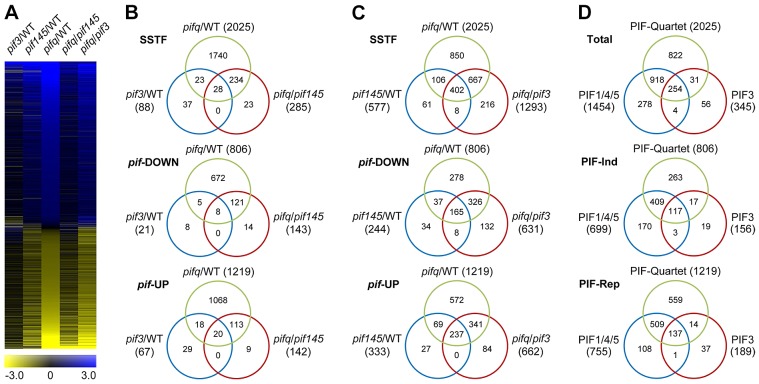
Figure 3. RNA–seq analysis of selected pif-mutants identifies PIF-regulated genes genome wide.
(A) Hierarchical clustering of differentially expressed genes by fold-change in expression (log2 scale), in the five pairwise genotypic comparisons indicated (pif3/WT, pif145/WT. pifq/WT, pifq/pif145 and pifq/pif3). Data shown are for the genes identified here as displaying Statistically-Significant, Two-Fold (SSTF) differences in any pairwise comparison. (B and C) Venn diagrams depicting total gene numbers (parentheses) and genes in common (overlapping sectors) that display SSTF differences in expression in the pairwise genotypic comparisons shown (Top Venn). Separation of genes into down-regulated (pif-DOWN; Middle Venn) and up-regulated (pif-UP; Bottom Venn) is based on the direction of the change in expression displayed in each pairwise comparison. (D) Venn diagrams summarizing the overlap between all identified PIF-quartet-, PIF1/4/5-trio- and PIF3-regulated genes. PIF3-regulated genes are defined as the combined total of the non-overlapping genes in the pif3/WT and pifq/pif145 sets in (B). PIF1/4/5-trio-regulated genes are defined as the combined total of the non-overlapping genes in pif145/WT and pifq/pif3 sets in (C). Separation of genes into PIF-induced (PIF-Ind; Middle Venn) and PIF-repressed (PIF-Rep; Bottom Venn) is based on the deduced action of the PIF proteins when present in WT seedlings.

