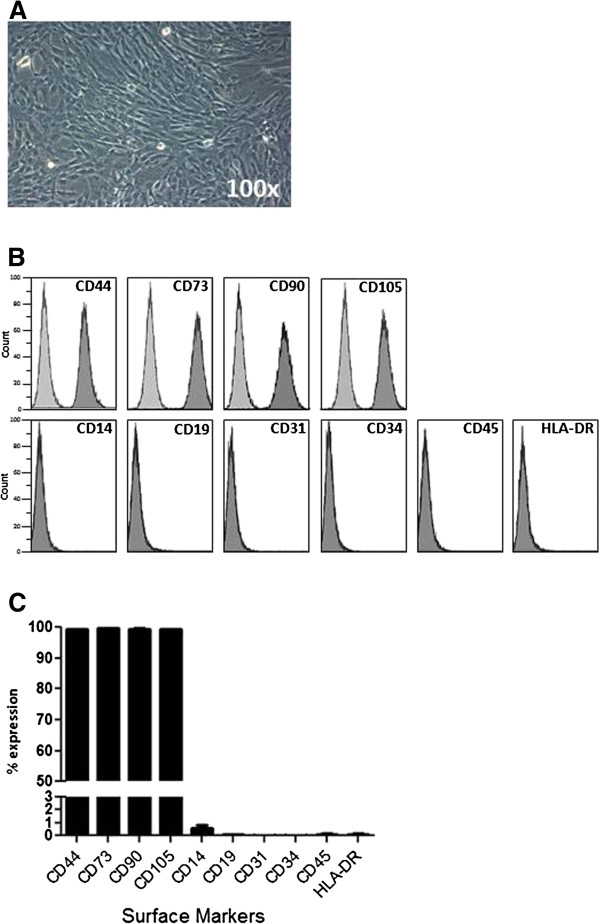
Figure 1.
UCX® cell characterization. Isolated UCX® cells presented (A) a fusiform, fibroblast-like morphology in culture. Results from Flow Cytometry analysis of cell surface markers presented in (B) histograms (UCX® cells in dark grey and isotype control in light grey) and (C) column bars. The values are represented as the mean ± SEM (n = 8).

