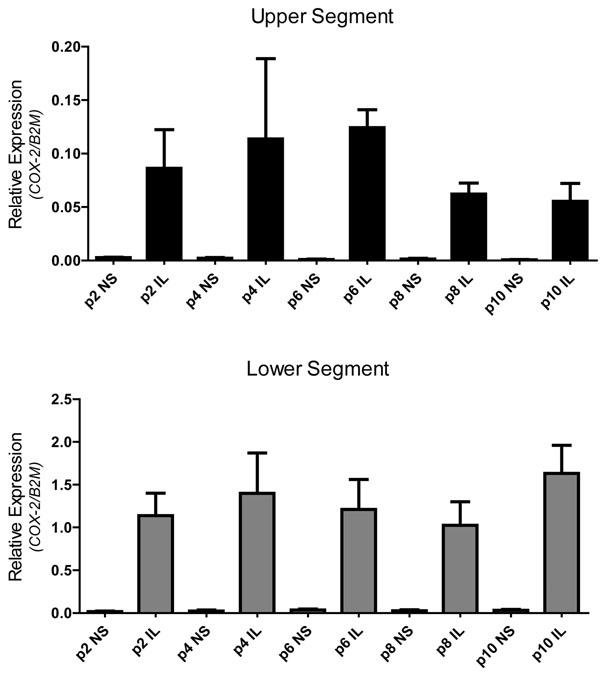
Figure 5.
IL-1β stimulates COX-2 mRNA expression in myometrial cells from p1 through p10 Relative expression of COX-2 normalized to B2M. Data represent the mean ± SEM of US (black) and LS (grey) myometrial cells. For simplicity only data from p2, p4, p6, p8 and p10 are depicted in the graph. NS = non-treated cells; IL = IL-1β-stimulated cells. ANOVA (P=0.0007 in upper and P<0.0001 in lower segment).

