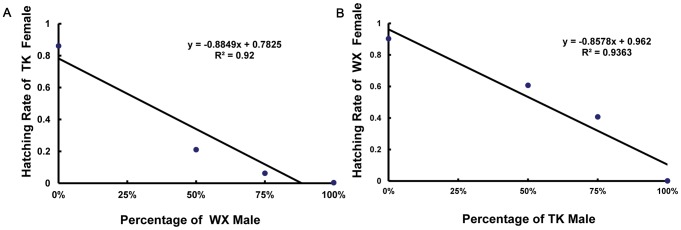
Figure 5. Correlation between group average hatching rate and the percentage of incompatible males.

The average hatching rate of a group was plotted against the percentage of incompatible males which was calculated by dividing the number of incompatible males by the total number of males (incompatible and cognate). (A) TK females with TK and WX males; (B) WX females with WX and TK males.
