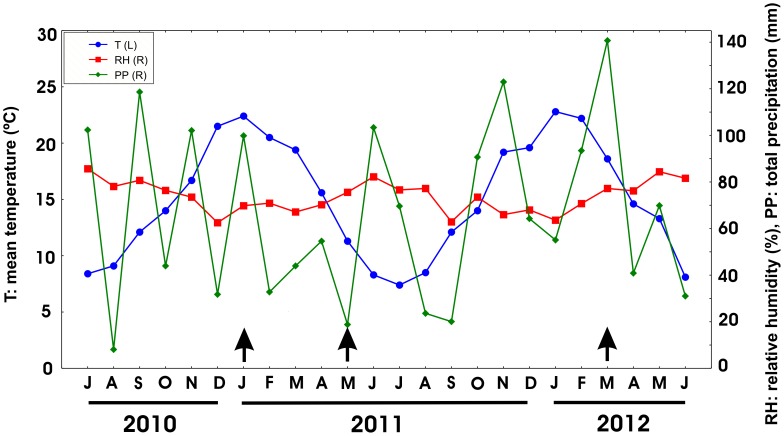
Figure 2. Weather conditions of the studied area, from July 2010 to June 2012.
On the left mean temperature in °C (T), on the right % of relative humidity (RH) and total precipitation in mm (PP). http://www.tutiempo.net/clima. Arrows indicate sampling times.

