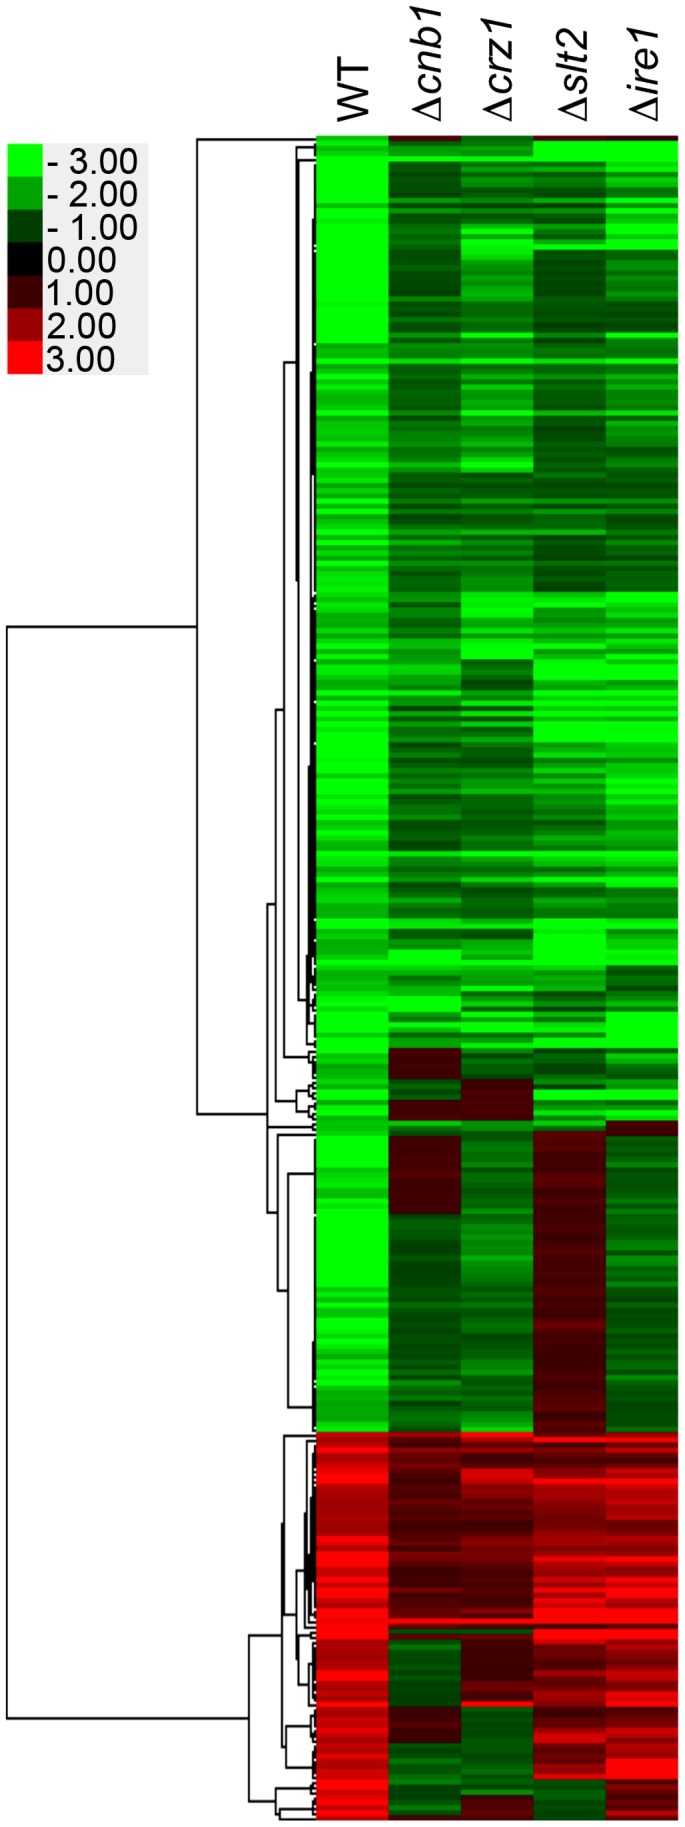
Figure 7. Genome-wide gene expression profiles in response to tunicamycin (TM) exposure for 3 h.

Hierarchical clustering of genes whose expression levels were changed more than 2-fold after treatment with 1.5 µg/ml TM for 3 h. Genes were clustered with centroid linkage. C. glabrata strains: WT, 2001T; Δcnb1, TG161; Δcrz1, TG171; Δslt2, TG151; and Δire1, TG121.
