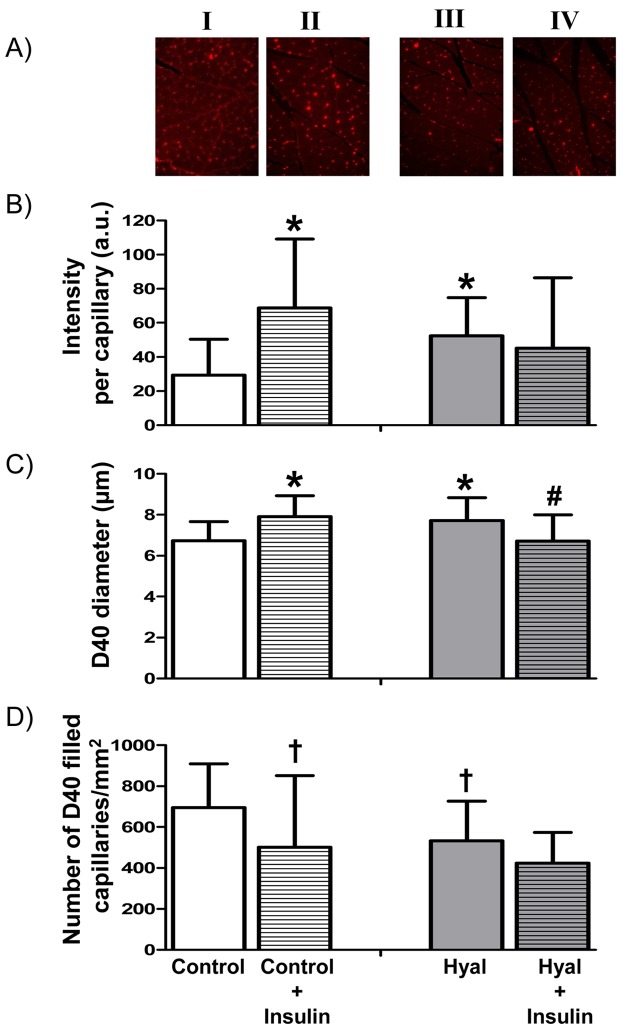
Figure 3. Typical examples of histological cross sections of rat hindlimb muscles at baseline in control rats (1 hour after saline; I, n = 18 slides), 30 minutes after insulin administration in control rats (II, n = 13 slides), 1 hour after a bolus of hyaluronidase (III, n = 17 slides) and 30 minutes after insulin in hyaluronidase treated rats (IV, n = 11 slides).
(A). In each slide the total intensity (B) and diameter (C) of each tracer filled capillary were determined, as well as the number of filled capillaries (D) (see Methods). In muscles of rats in which no tracer was infused (n = 12), the number of counted capillaries was 102 and total intensity in these capillaries was 18.8; data in panels B and D are corrected for these values. *, P<0.05 versus control baseline (unpaired student’s t-test); † , P<0.05 versus control baseline (Mann-Whitney U test); # , P<0.05 versus hyaluronidase baseline (unpaired student’s t-test).

