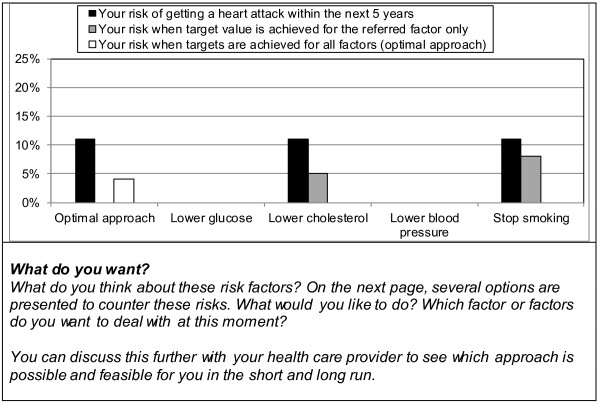
Figure 5.
Bar graph showing the patient’s possible risk reductions for each risk factor with accompanying questions. Shown are the patient’s possible risk reduction when all or each of the separate risk factors would reach the recommended target values. Below the graph the accompanying questions asked in the decision aid are presented.

