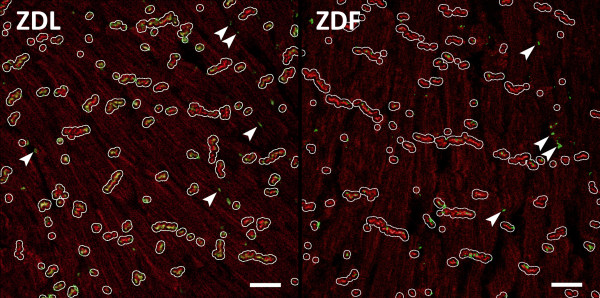
Figure 3.

Connexin43 localization. Representative images from ZDL and ZDF rats used for quantification of Cx43 colocalizing with N-cadherin. Sections of ventricular myocardium were stained for N-cadherin (red) and Cx43 (green). White lines show the enlarged regions of N-cadherin (see Materials and Methods) used to identify the intercalated disc. Green staining (Cx43) within these regions were regarded as localized in intercalated discs. Cx43 outside the N-cadherin regions was regarded as lateralized. The arrows point to examples of lateralized Cx43. (Scale bar is 25 μm).
