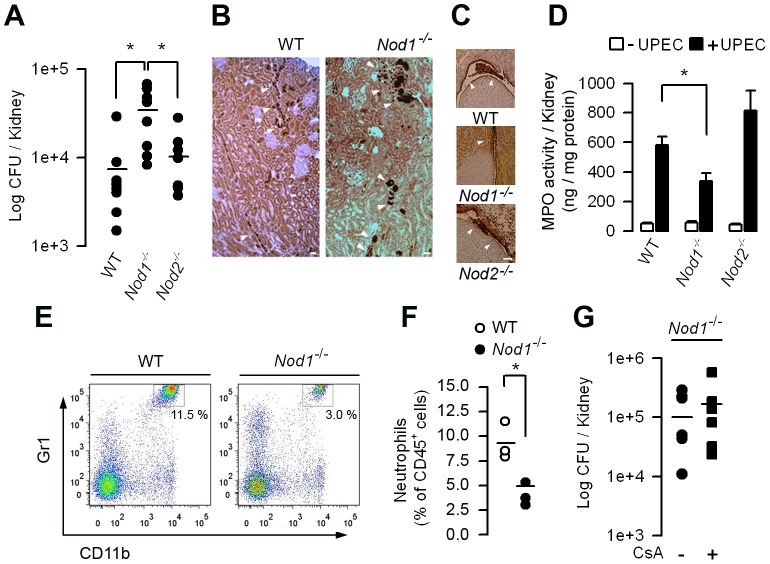
Figure 3. Nod1−/− mice display increased susceptibility to renal retrograde UPEC infection.
(A) Bacterial loads in kidneys from WT, Nod1−/− and Nod2−/− mice (n = 8 per group) 24 h after the transurethral inoculation of UPEC strain HT7. Horizontal bars are the mean value of each group. (B) Illustrations of the E. coli immunostaining (arrowheads) in the infected WT and Nod1−/− mice kidneys. Bars = 100 µm. (C) Illustrations of neutrophils infiltrates (arrowheads) in the urinary space from post-infected WT, Nod1−/−, and Nod2−/− kidneys. Bars = 100 µm. (D) Levels of MPO activity in kidney homogenates from post-infected WT, Nod1−/−, and Nod2−/− mice. (E and F) Flow cytometry analysis of the CD45+ leukocyte population infiltrating the infected kidneys from WT and Nod1−/− mice 24 h after UPEC inoculation. Representative dot-plots of CD45+ F4/80− renal cells (E) and percentages (E, upper right insets and F) of F4/80− CD11b+ Gr1HI neutrophils infiltrating the infected WT and Nod1−/− mice kidneys. The bars indicate the mean percentage of neutrophils over total CD45+ leukocytes (n = 3 mice per group. (G) Bacterial loads in kidneys from untreated (–) and day-5 Nod1−/− mice (n = 8 per group) 24 h after the transurethral inoculation of the UPEC strain HT7. Horizontal bars are the mean value of each group. Values are presented as mean ± SE. *, p<0.05 (A, D, Mann-Whitney test; F, G, Two-tailed, unpaired Student's t test).

