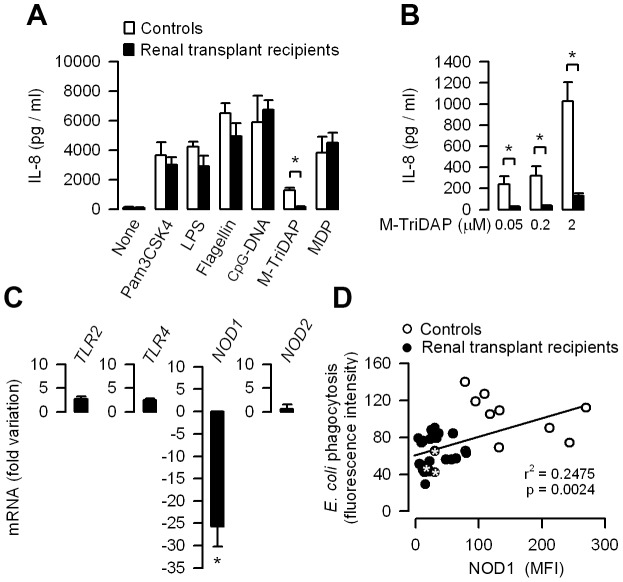
Figure 9. Functional downexpression of NOD1 in leukocytes from CsA-treated renal transplant recipients.
(A) IL-8 production in blood samples from healthy volunteers (Controls, n = 10) and renal transplant recipients treated with CsA (n = 25) incubated without (None) or with 1 ng/ml Pam3CSK4 or LPS, 1 µg/ml flagellin, 50 µg/ml CpG-DNA, 1 µM M-TriDAP or MDP. (B) IL-8 production in blood samples from Controls and renal transplant recipients incubated with increasing concentrations of M-TriDAP. (C) Relative fold variation of TLR2, TLR4, NOD1 and NOD2 mRNAs in blood samples from renal transplant recipients (n = 25) compared to that found in Controls (n = 10). (D) Flow cytometry analyses of phagocytosed E. coli (expressed as fluorescence intensity of internalized E. coli) and mean fluorescence intensity (MFI) of NOD1 expression in neutrophils from healthy volunteers (n = 10) and renal transplant recipients treated with CsA (n = 25). * Transplant recipients who experienced UTI/APN. Values are presented as mean ± SE from n determinations per condition tested. *, p<0.05 (A, B, Two-tailed, unpaired t test; C, Mann-Whitney test).

