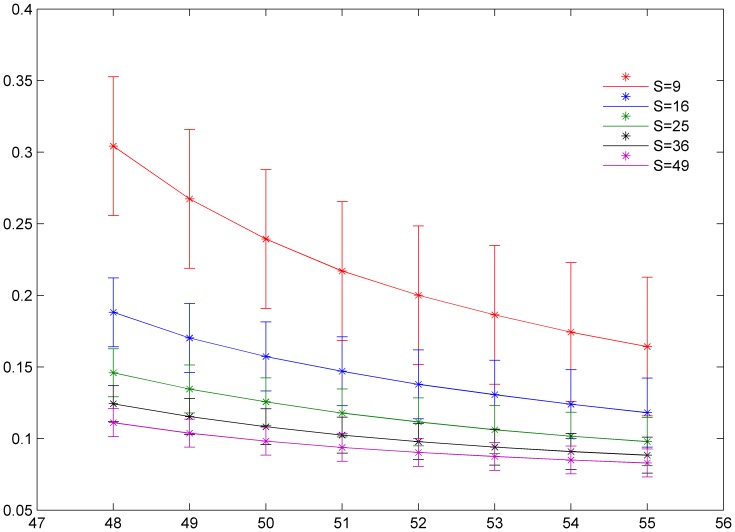
Figure 1. The distribution of factor of synchronization vs. forcing currents with diversity.
The size of local area forced with current I 0 is marked as S = 9 (90≤i ≤92, 90≤j ≤92), S = 16 (90≤i ≤93, 90≤j ≤93), S = 25 (90≤i ≤94, 90≤j ≤94), S = 36 (90≤i ≤95, 90≤j ≤95), S = 49 (90≤i ≤96, 90≤j ≤96), coupling intensity D = 4 and transient period is about 800 time units.

