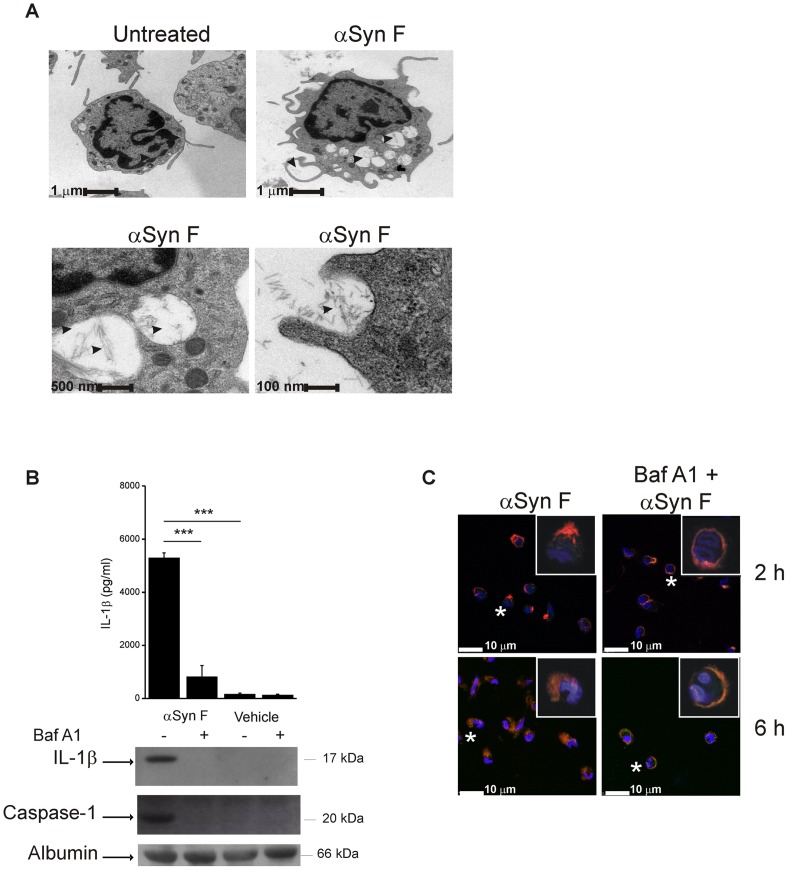
Figure 3. Phagocytosis of αSyn F is required for IL-1β release.
(A) Transmission electron microscopy of monocytes treated for 6 h with 40 nM αSyn F, or left untreated. For αSyn F-treated cells, three magnifications are shown (bars represent 1 µm, 500 nm and 100 nm). Pictures of 20–30 cells for each condition were kept and 3 representative cells are shown. Left bottom panel is the magnification of two αSyn-containing vacuoles of the cell in the right upper panel. Arrowheads indicate the fibrils. (B) Monocytes were pre-incubated for 30 min with 250 nM Baf A1, or left untreated, before being exposed for 6 h to αSyn F or vehicle. IL-1β released into the culture supernatants was evaluated both by ELISA and immunoblot analysis. The same supernatants were assessed for the accumulation of active caspase-1 by immunoblot. Results are the mean ± S.D. of 3 experiments conducted in duplicate with cell preparations obtained from 3 different donors. The immunoblot is from one representative donor. ***p<0.001. (C) Confocal microscopy of monocytes incubated with 250 nMBaf A1 before and during the exposure for 2 or 6 h to αSyn F. Red staining corresponds to rhodamine-labelled αSyn F, while the Hoechst blue staining labels nuclei. White asterisks indicate the cells of which a magnification is shown (white square).

