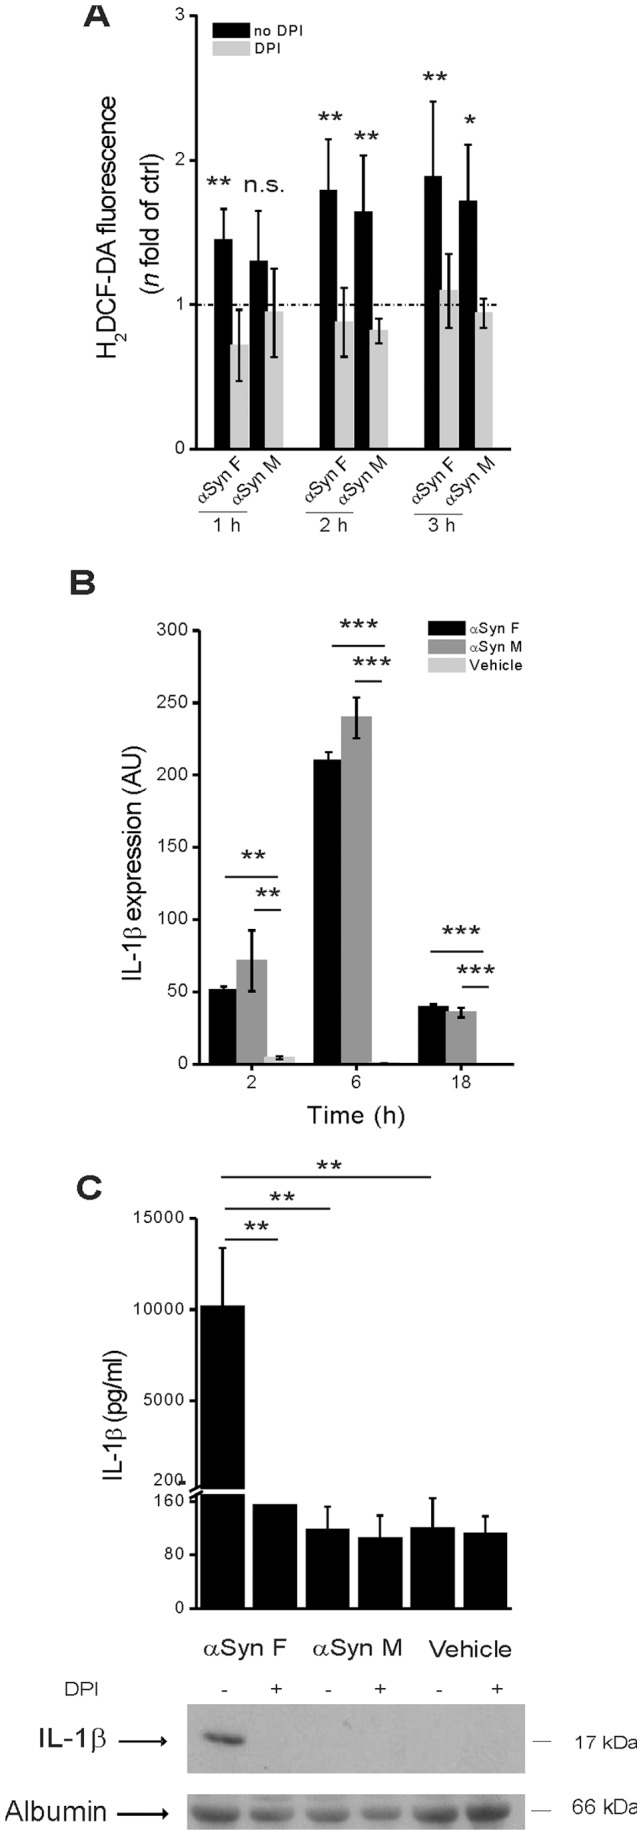
Figure 5. Only αSyn F is capable of activating the inflammasome.

(A) Monocytes were cultured for 1, 2 or 3 h in the presence of 40 nM αSyn F or 1 µM αSyn M and intracellular ROS levels were quantified by the H2DCF-DA fluorometric method. When required, monocytes were pre-incubated for 30 min with 20 µM DPI. The dotted line refers to the basal levels of ROS production (as in untreated monocytes). Results are the mean ± S.D. of 5 experiments conducted in duplicate with cell preparations obtained from 5 different donors. *p<0.05, **p<0.01 was calculated for samples not exposedto DPI vs the correspondent samples with DPI. (B) Monocytes were exposed for 2, 6 and 18 h to 40 nM αSyn F, or 1 µM αSyn M or vehicle (saline) and the expression of pro-IL-1β was evaluated by real-time PCR. Real time data are shown as the mean ± S.D. of results obtained with cell preparations from 2 different donors; experiments with each cell preparation were conducted in duplicate. **p<0.01 and ***p<0.001. (C) Monocytes were pre-incubated for 30 min with 20 µM DPI, or left untreated, before being exposed for 6 h to αSyn F or αSyn M or vehicle. IL-1β was determined as before. Results are the mean ± S.D. of 3 experiments conducted in duplicate with cell preparations obtained from 3 different donors. The immunoblot is from one representative donor. **p<0.01.
