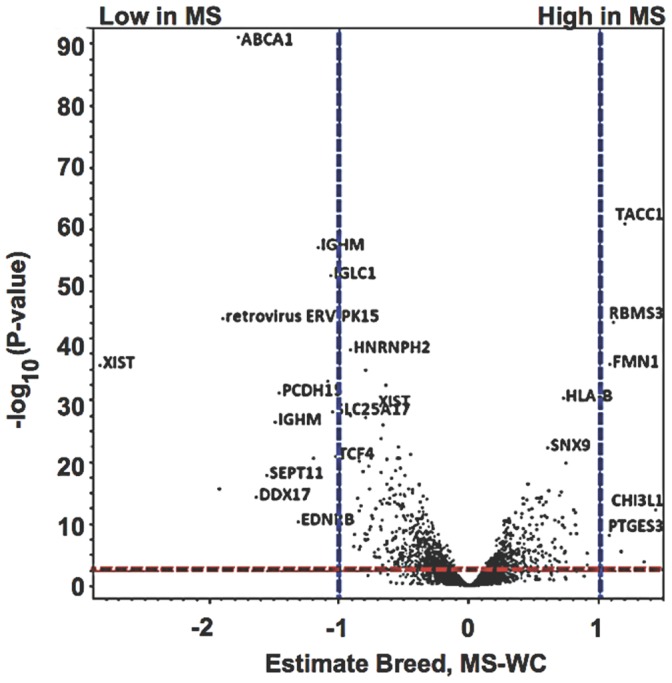
Figure 1. Differential placental gene expression in Meishan versus WC swine breeds.

Volcano plots were used to visualize differential expression between Meishan and White Composite placental tissues against level of significance surveyed for breed specific differences. The x-axis is the log2 fold-change difference of the Meishan minus WC breed groups. The vertical axis represents the statistical evidence as a measure of the –log10 transformation of the p-value for each test of differences between samples. Each of the ∼24,000 oligonucleotide probe sets is plotted. A red dashed line indicates the FDR adjustment (approximately q-value <0.05) to correct for multiple testing. Blue dashed lines showed estimates of 1, and −1, which corresponds to a 2-fold (inverse natural logarithm of estimates) increase or decrease respectively.
