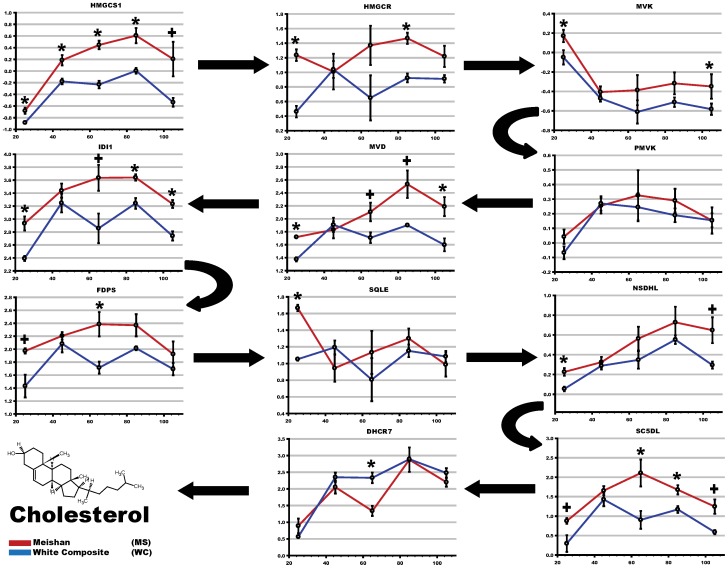
Figure 5. Temporal changes in cholesterol biosynthesis gene expression throughout gestation.
To visualize and identify patterns of gene expression, the KEGG cholesterol biosynthetic genes were plotted at each gestational time point (x-axis) using mean intensities (y-axis) of normalized microarray data. Arrows denote the metabolic flux through biochemical pathway: that is, the biochemical steps in which acetyl co-enzyme A is processed into cholesterol. A shaded grey box is overlaid for convenience to show the D45–D65 breed-specific cholesterol pattern.

