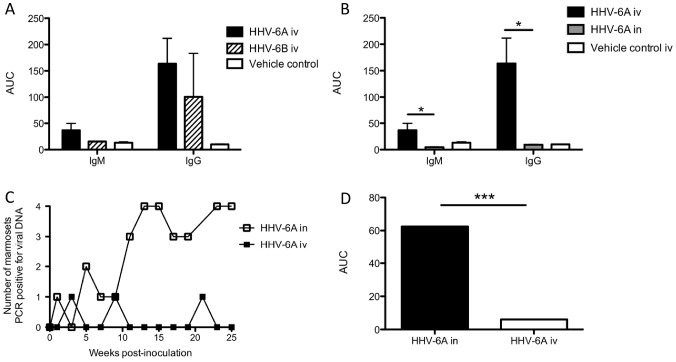
Figure 4. Differences in HHV-6-specific antibody responses and detection of viral DNA between experimental groups.
(A) Comparison of virus-specific IgM and IgG responses between HHV-6A and HHV-6B-intravenously inoculated (iv) marmosets. AUC is calculated from Figure 3. (B) Significantly elevated virus-specific IgM and IgG responses in marmosets inoculated with HHV-6A intravenously compared to marmosets inoculated with HHV-6A intranasally (p = 0.0286, Mann Whitney U test). AUC is calculated from Figures 3, 5. (C, D) The number of marmosets testing positive for viral DNA was significantly greater in the HHV-6A intranasal group compared to the HHV-6A intravenous group (p = 0.003, Mann Whitney U test). AUC in (D) is calculated from (C). AUC: Area under the curve.

