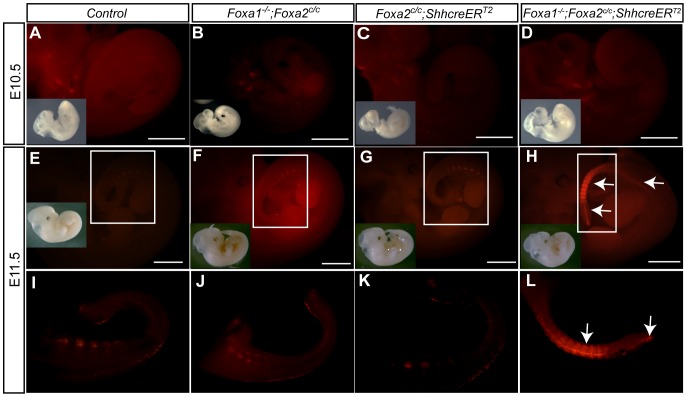
Figure 3. Cell Death is increased in the tail of E11.5 but not E10.5 Foxa1;Foxa2 double mutant embryos.
Cell death was assayed using LysoTracker on live embryos at E10.5 and E11.5. A–D. Control (A), Foxa1 null (B), Foxa2 notochord knockouts (C), and Foxa1;Foxa2 double knockout embryos (D) had similar amounts of cell death at E10.5. Inset is a brightfield image of an E10.5 embryo shown for reference. Scale bar for the LysoTracker is 1 mm. E–H: At E11.5, control (E and I), Foxa1 null (F, J) and Foxa2 notochord knockout (G and K) embryos had LysoTracker positive cells in the somites, dorsal tail, and end of the tail but were indistinguishable from one another. In contrast, double mutant embryos (H and L) had numerous LysoTracker positive cells in the somites and midline of the tail (white arrows). Images I–L are zoomed in areas denoted by the boxes in E–H. The insets in E–H are brightfield images of E11.5 embryos. The scale bar for the LysoTracker images in E–H is 1 mm.

