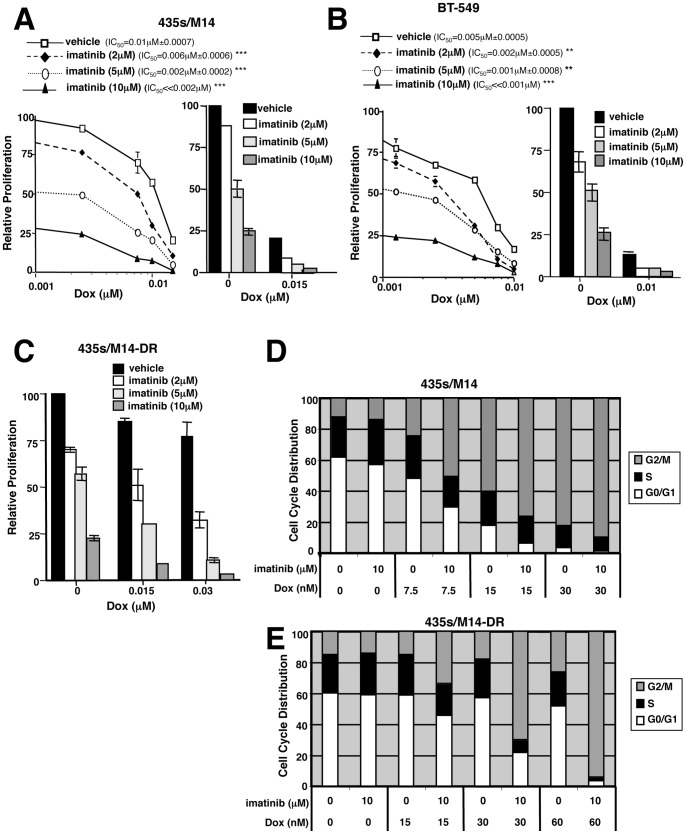
Figure 2. Imatinib abrogates doxorubicin resistance, in part, by potentiating doxorubicin-mediated G2/M arrest.
(A–C) Proliferation was assessed in treated cells (72 h) by tritiated thymidine assay. Representative dose response curves (A, B, left) and Mean±SEM for 3 independent experiments (A–C, right). Some error bars are too small to visualize. (C) CI values: Dox(0.015 µM)+imatinib(2 µM) = 0.9±0.14; Dox(0.015 µM)+imatinib(5 µM) = 0.67±0.07; Dox(0.015 µM)+imatinib(10 µM) = 0.5±0.06; Dox(0.03 µM)+imatinib(2 µM) = 0.8±0.11; Dox(0.03 µM)+imatinib(5 µM) = 0.5±0.13; Dox(0.03 µM)+imatinib(10 µM) = 0.36±0.18. (D, E) Asynchronous drug-treated cells (72 h) were analyzed by FACS. Experiments were performed ≥3 times, and representative cell cycle distributions are shown. Mean±SEM for 3 independent experiments is shown in Figure S4E. **p≤0.01, ***p<0.001 (see methods).

