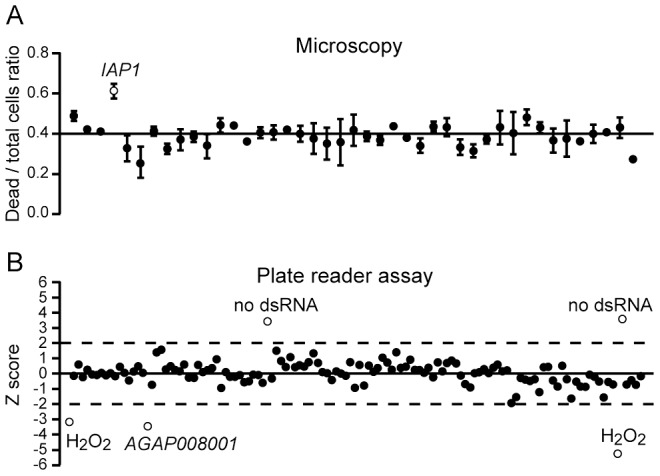
Figure 1. Cell growth and viability screen.

(A) A fraction of the dsRNA hemocyte-specific library was screened twice by automated fluorescence microscopy. Fluorescent cells were automatically counted using protocols developed in Volocity Improvision and ImageJ software, as described in Materials and Methods. The ratios of dead cells (Sytox Green positive) over the total number of cells (Hoechst positive), and the standard deviation of replicates, are shown. (B) The entire dsRNA collection was screened using the Cell Titer Blue/Plate Reader method. The plot shows the z-score analysis of one representative set of experiments. A z-score threshold of at least 2 was chosen, and positive hits are shown as open circles. No dsRNA-treated samples and samples treated with 100 mM H2O2 are also indicated. Three biological replicates were performed.
