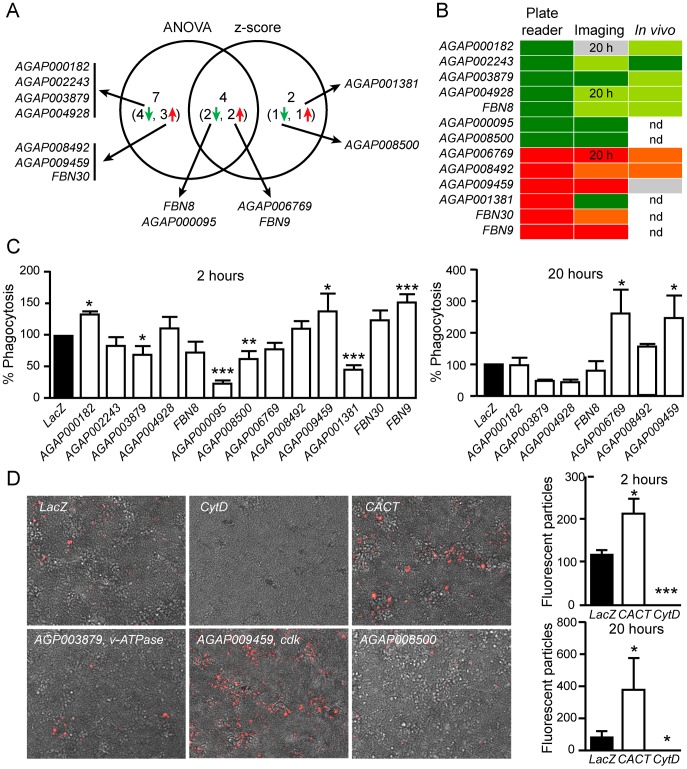
Figure 2. Bacterial phagocytosis screen.
(A) Venn diagram showing the results of the z-score and ANOVA analyses of data obtained with the microplate reader phagocytosis assay. (B) Heat map depicting the performance in the microscopy imaging and in vivo phagocytosis assays of the 13 dsRNAs identified as positive hits with the microplate reader assay. Dark green, significant decrease of phagocytosis; green, decrease of phagocytosis; dark red, significant increase of phagocytosis; red, increase of phagocytosis; grey, similar to LacZ control; nd, not determined. (C) Microscopy imaging analysis: phagocytosis rates of cells at 2 and 20 h following bioparticles challenge when genes identified as modulators of phagocytosis by microplate reader assay are silenced. Data are shown as percent phagocytosis compared to dsLacZ-treated controls. (D) Examples of fluorescence microscopy images of Sua5.1* cells treated with dsRNAs or Cytochalasin D. Images were captured 20 h after challenge with pHRodo bioparticles. The graphs indicate the capacity of cells to uptake bioparticles following dsLacZ, dsCactus and Cytochalasin D treatments at 2 and 20 h after challenge, as quantified by image analysis. Mean values of counted particles and standard errors are reported. Results from two experiments are shown. Asterisks indicate statistically significant differences between each KD and the dsLacZ-treated controls (*: P<0,05; **: 0,005<P<0,05; ***: 0,0005<P<0,005).

