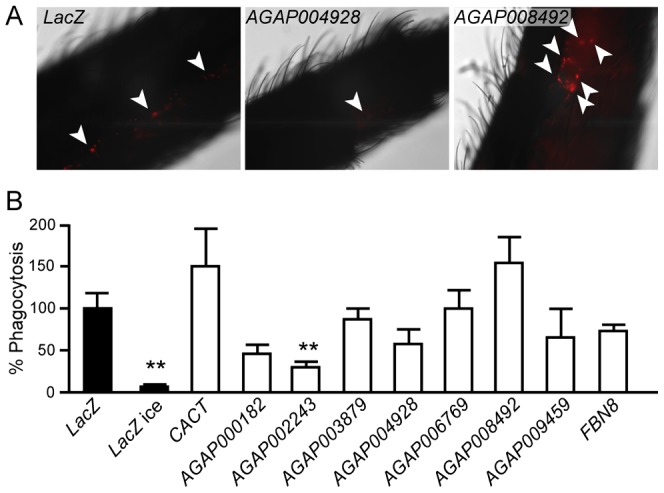
Figure 3. In vivo phagocytosis assay.

(A) Pictures of abdominal segments of adult female mosquitos injected with dsLacZ, dsAGAP004928 and dsAGAP008492 and then challenged with pHRodo E. coli bioparticles. Fluorescence and brightfield images were captured and hemocytes containing fluorescent bioparticles quantified. The experiment was repeated twice with 8–10 mosquitoes per treatment. Quantification of fluorescent bioparticles and statistical analysis were performed as described in Materials and Methods. (B) The graph shows the percentage of phagocytosis of the different KDs placing dsLacZ as reference. Mean values and standard errors are reported. Asterisks indicate statistical significance (**: 0,005<P<0,05) according to t-tests applied to each gene KD compared to LacZKD.
