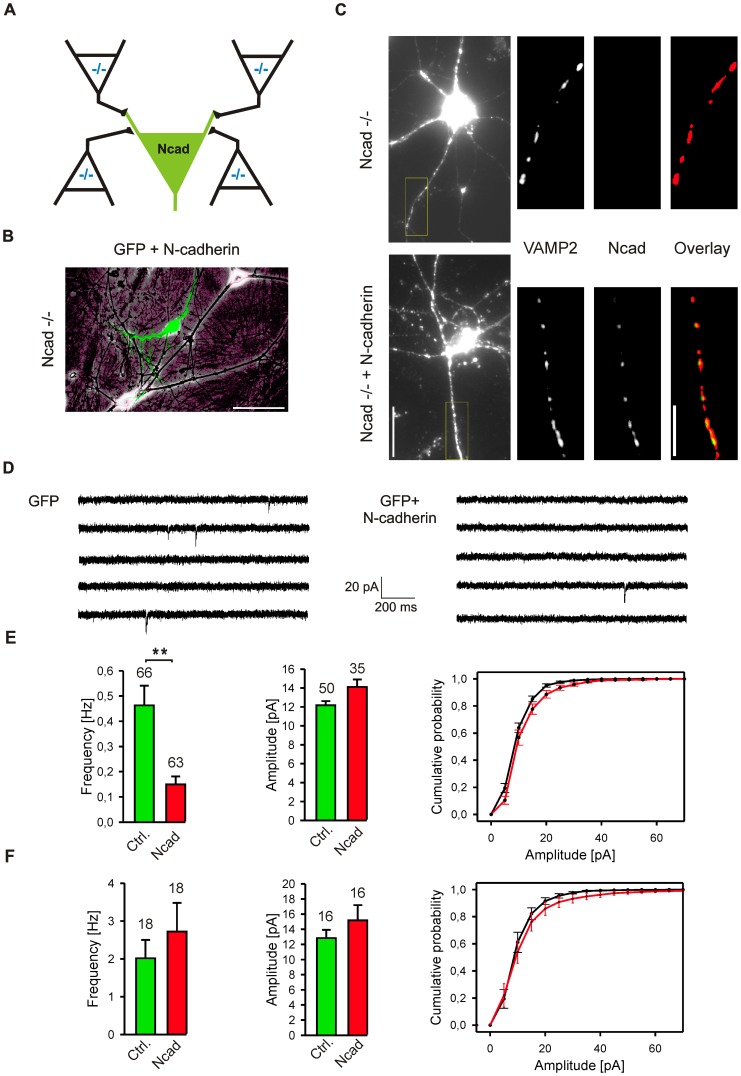
Figure 1. Asymmetric, selectively postsynaptic expression of N-cadherin impairs basal function of glutamatergic synapses.
(A) Scheme of N-cadherin+EGFP expression in individual, transfected N-cadherin knockout neurons (Ncad; green) innervated by surrounding, not transfected N-cadherin knockout neurons (−/−; derived from mouse ES cells). (B) Overlay of a phase contrast image of cultured N-cadherin knockout neurons and the corresponding fluorescence image of a N-cadherin+EGFP transfected neuron (12 DIV, 2 days after transfection). Scale bar represents 30 µm. (C) Left: Fluorescence images (VAMP2 immunostaining) of a knockout (Ncad−/−) and a transfected (Ncad−/− + N-cadherin) neuron immunostained for VAMP2 and N-cadherin. The dendritic segment indicated in the whole cell image is shown enlarged and thresholded. Center: Corresponding N-cadherin immunostaining of the same dendritic segment. Right: Overlay of VAMP2 and N-cadherin immunostaining of the same dendritic segment. Scale bars represent 15 µm and 5 µm. (D, E) Spontaneous, AMPA receptor mediated miniature EPSCs recorded from an EGFP transfected, N-cadherin knockout neuron (GFP, control) and from a N-cadherin+EGFP transfected, N-cadherin knockout neuron (Ncad, mis-match). Patch-clamp recordings 2 days after transfection; holding potential −60 mV. (E) Quantification of the frequency and the amplitude (cells without mEPSCs not included) of AMPA mEPSCs (11–13 DIV). Cumulative distribution of mEPSC amplitudes is shown in the right panel. Note the strong reduction in mini frequency in neurons with asymmetric N-cadherin expression. (F) Control postsynaptic overexpression of N-cadherin in primary cultured cortical neurons. Patch-clamp recordings 2 days after transfection; holding potential −60 mV. Quantification of the frequency and the amplitude of AMPA mEPSCs with cumulative distribution of mEPSC amplitudes shown in the right panel. Means ± SEM. n (cells) is indicated on bars. **, P<0.001 Students t-test.

