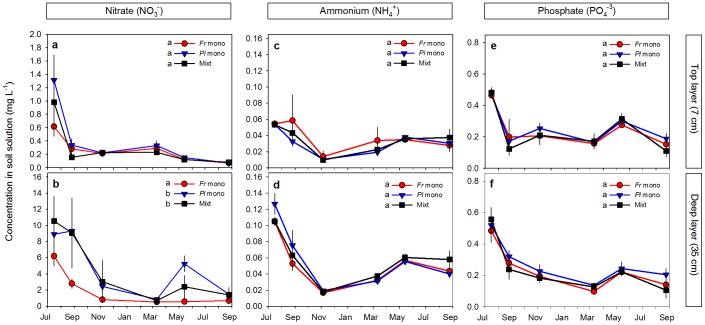
Figure 3. Nutrients dynamics in soil solution over time.
Nitrate (a, b), ammonium (c, d) and phosphate (e, f) concentration in Festuca rubra and Plantago lanceolata monocultures and in mixtures of the two species, at 7 and 35 cm depth. In nitrate, different letters in legends show significant differences between species over time, after ANCOVAlayer x species. Data are means ± SE, N = 3–4. No significant second and third order interactions involving species and time were detected (Table 1), meaning that similarities/differences between species were consistent all over the experimental period. Soil nutrient concentrations were derived from regular sampling of soil water over the course of the experiment through porous suction cups that had been placed in the soil layers.

