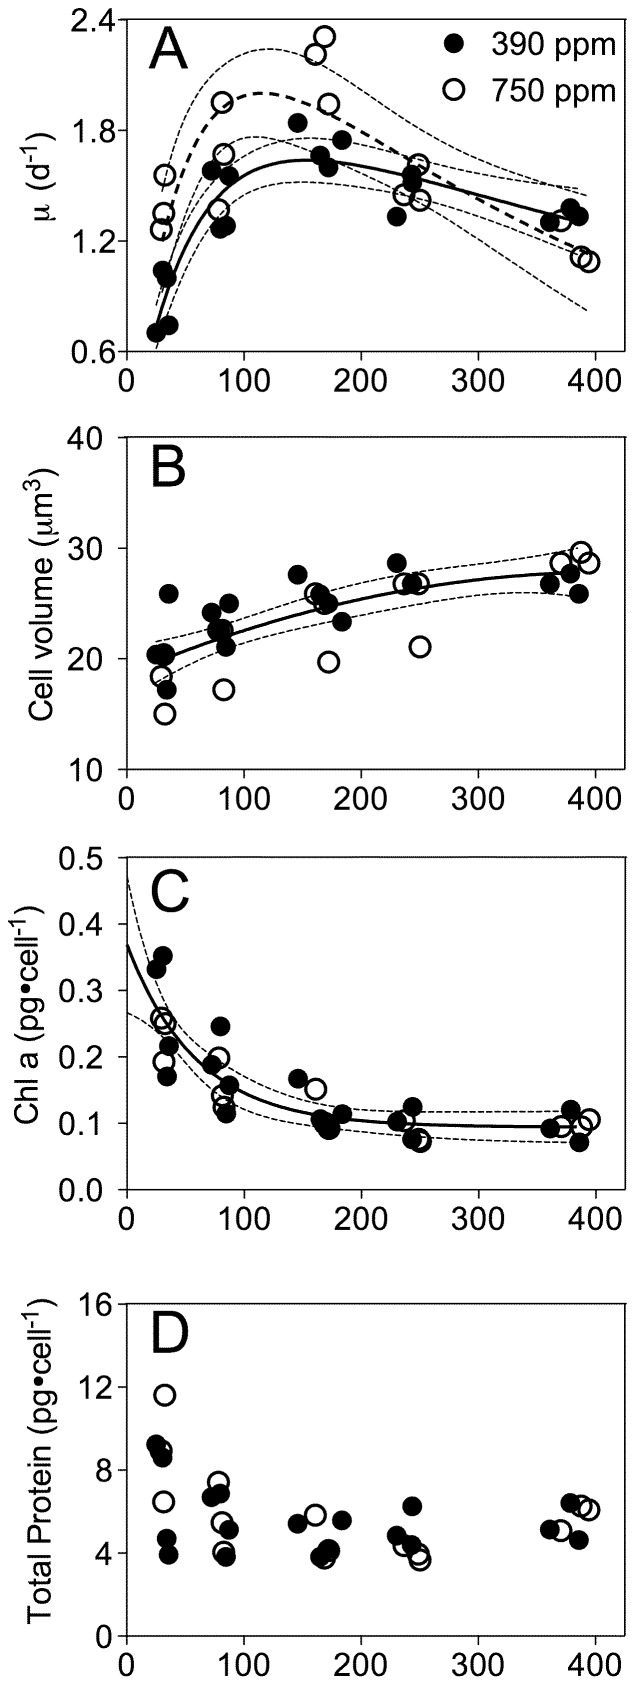
Figure 2. Growth rate, cell volume, Chl a and cellular protein versus growth light.
A) Growth rate versus culture growth light under ambient or elevated pCO2. Solid line: Light response curve for growth of cultures at ambient pCO2. Dashed line: Light response curve for growth of cultures at elevated pCO2. Thin dotted lines: 95% confidence intervals on the fitted curves. B) Cell volume versus growth light under ambient or elevated pCO2. Solid line: Polynomial curve for pooled growth light response of cell volume for growth of cultures under the two CO2 treatments. Thin dotted lines: 95% confidence intervals on the fitted curve. C) Chlorophyll a versus culture growth light under ambient or elevated pCO2. Solid line: Polynomial curve for pooled growth light response for cultures from the two CO2 treatments. Thin dotted lines: 95% confidence intervals on the fitted curve. D) Total protein per cell versus culture growth light under ambient or elevated pCO2. E) Chl a:total protein versus culture growth light under ambient or elevated pCO2. Solid line: Polynomial curve for cultures from ambient pCO2. Dashed line: Polynomial curve for cultures from elevated pCO2. Thin dotted lines: 95% confidence intervals on the fitted curves.

