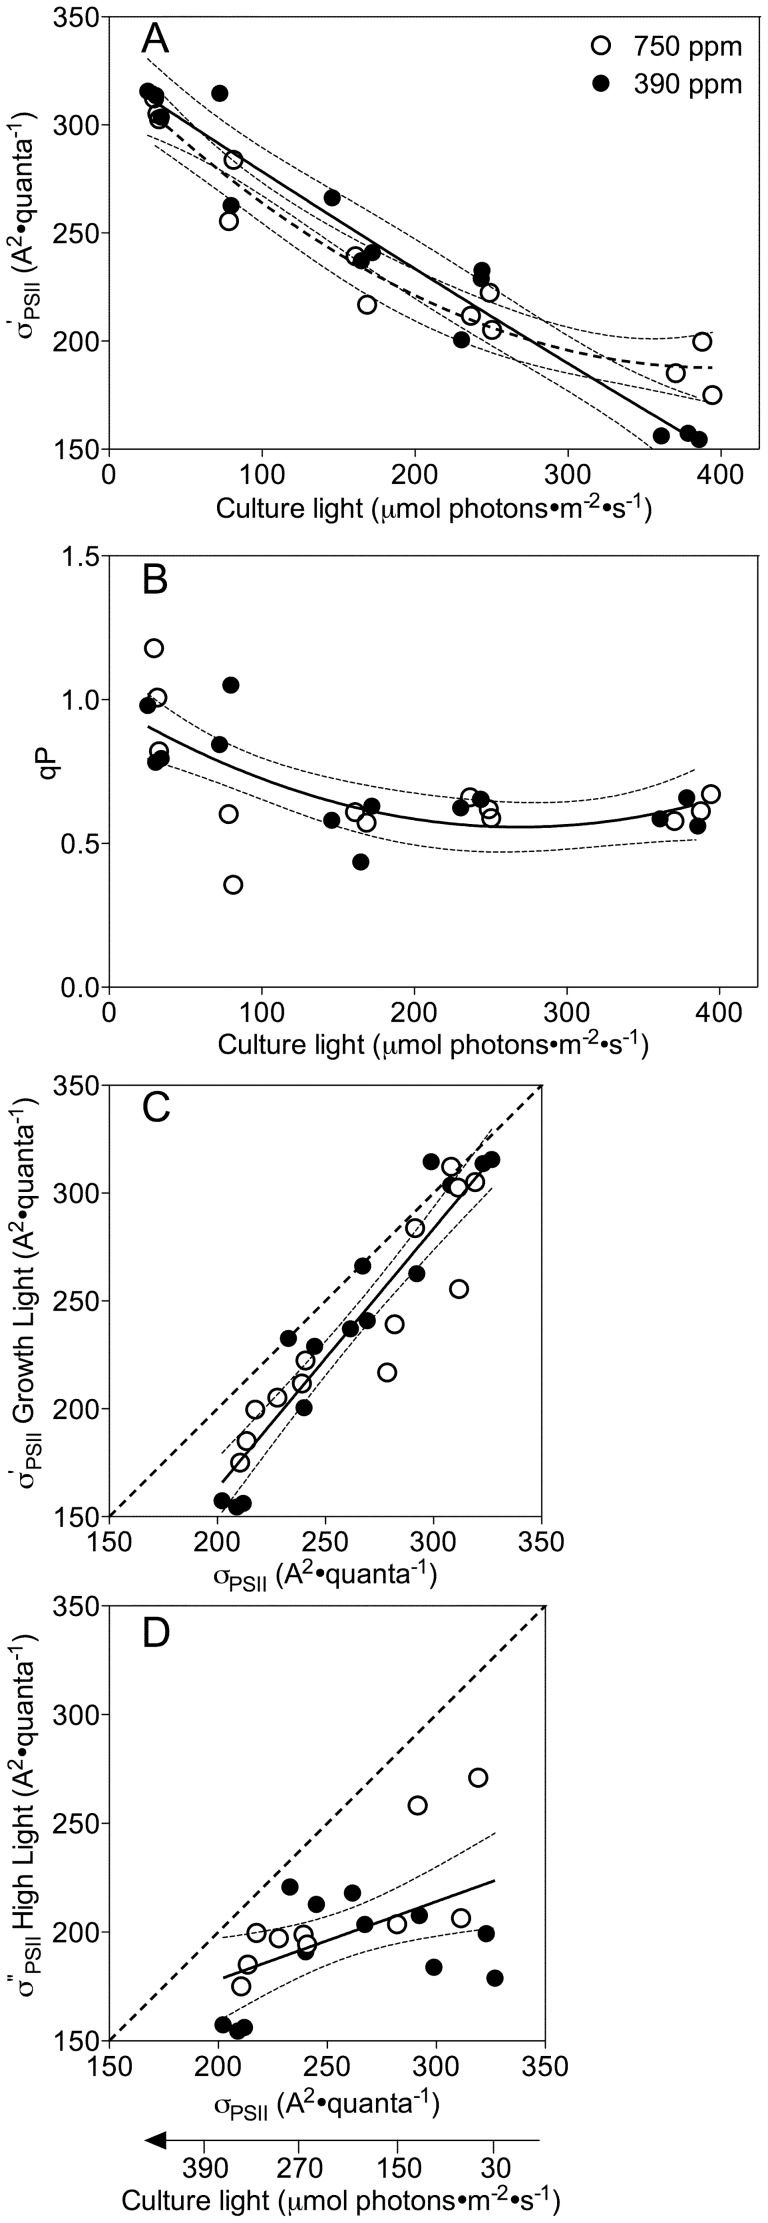
Figure 4. Effects of growth light and pCO2 on functional absorption cross-section for PSII photochemistry.
A) Functional absorption cross-section for Photosystem II measured under culture light level (σ′PSII, A2·quanta−1) under ambient or elevated pCO2 plotted against the culture growth light (µmol photons·m−2·s−1). Solid line: Polynomial curve for growth light response of σ′PSII under ambient pCO2. Dashed line: Polynomial curve for light response of σ′PSII under elevated pCO2. Thin dotted lines: 95% confidence intervals on the fitted curves. B) Photochemical quenching (qP) versus growth light under ambient or elevated pCO2. Solid line: Polynomial curve for pooled growth light response for cultures from the two CO2 treatments. Thin dotted lines: 95% confidence intervals on the fitted curve. C) Functional absorption cross-section (σ′PSII) of the samples measured after 2 min of acclimation to culture-light, as a function of σPSII measured after 5 min dark-acclimation. Solid line: Linear regression of pooled response of cultures from ambient and elevated pCO2. Thin dotted lines: 95% confidence intervals on the fitted curve. Dotted diagonal line indicates 1∶1 ratio. D) Functional absorption cross-section (σ″PSII) of the samples measured after 2 min of acclimation to high-light of 450 µmol photons·m−2·s−1, as a function of σPSII measured after 5 min dark-acclimation. Solid line: Linear regression of pooled response of cultures from ambient and elevated pCO2. Thin dotted lines: 95% confidence intervals on the fitted curve. Dotted diagonal line indicates 1∶1 ratio.

