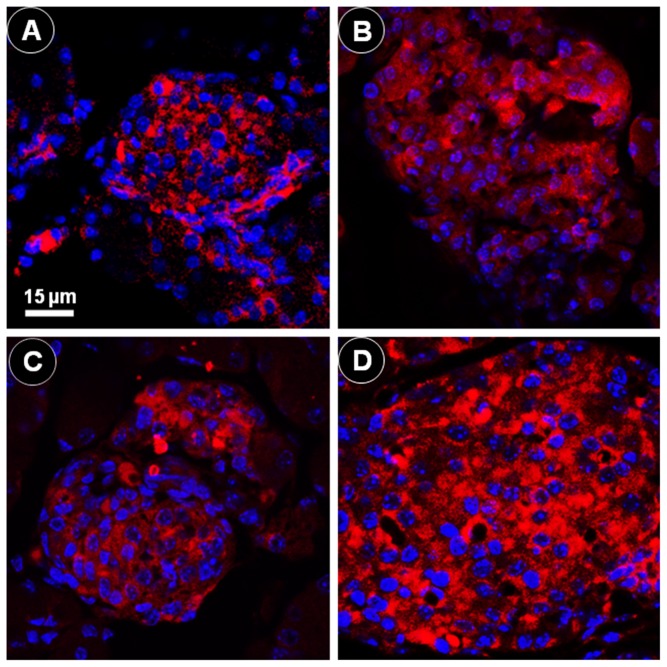
Figure 12. Offspring islets.
Positive immunofluorescence reaction for insulin (red color) and DAPI nucleic acid staining (blue color), observed via confocal laser scanning microscopy: (A) standard chow (SC) group, day 0; (B) SC group, day 10; (C) high fat diet (HF) group, day 0; (D) HF group, day 10 (same magnification in all pictures). The images were used to measure the inter-cell nuclear distance as a measure of the beta cell size characterizing cell hypertrophy. The distance increased significantly from day 0 to day 10 in the HF group.

