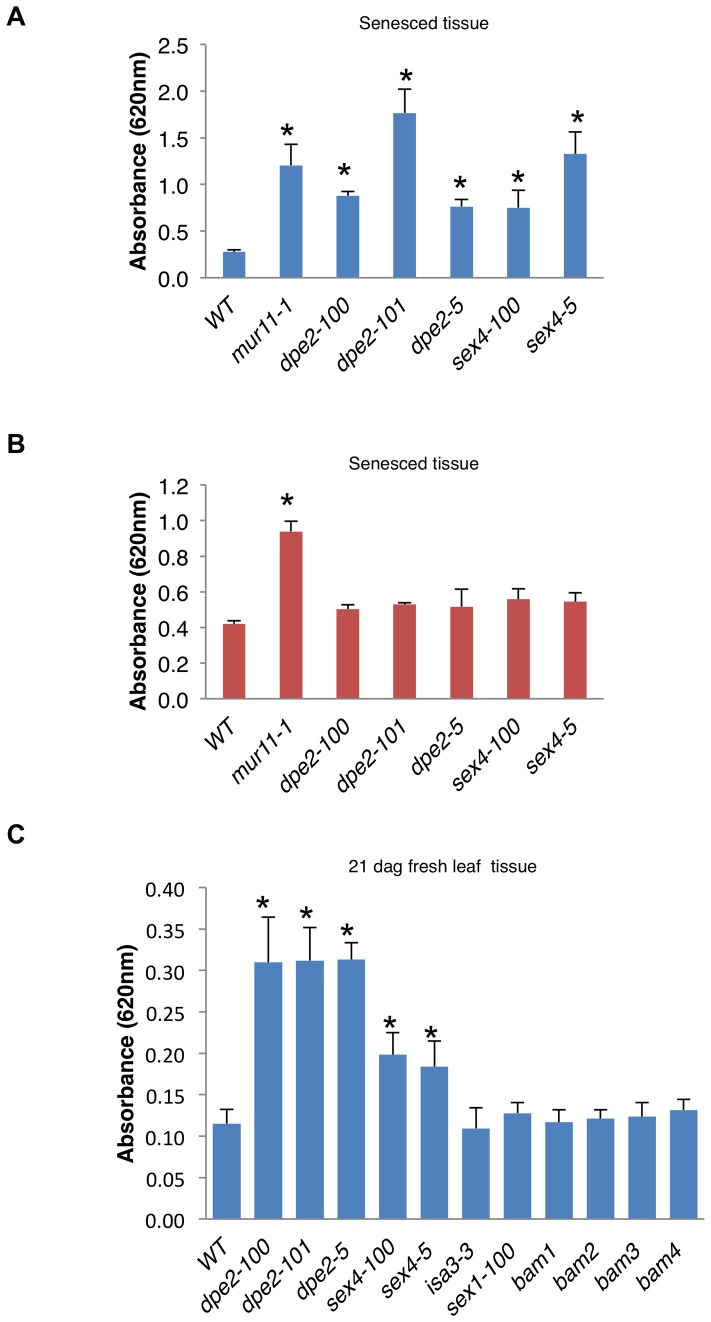
Figure 3. Starch analysis of rah mutants mur11, dpe2 and sex4.
(A) Senesced stem tissue from starch mutants was treated with α-amylase and the amount of sugar from starch released was quantified using the anthrone method. Graph shows absorbance at 620 nm per 0.25 mg dry tissue; values are averages ± s.d. (n = 4). We repeated all experiments two times with similar results. (B) Post-amylase treatment, tissue from (A) was assayed by acid hydrolysis for residual sugar release using 1 M H2SO4. Graph shows absorbance at 620 nm per 0.25 mg dry tissue; values are averages ± s.d. (n = 3). (C) Acid hydrolysis of fresh leaf disc tissue from known starch mutants using 1 M H2SO4. Graph shows absorbance at 620 nm for ¼ of a leaf disc hydrolysate; values are averages ± s.d. (n = 4). We repeated all experiments at least three times with similar results. *, P<0.01 using Student's t-test.

