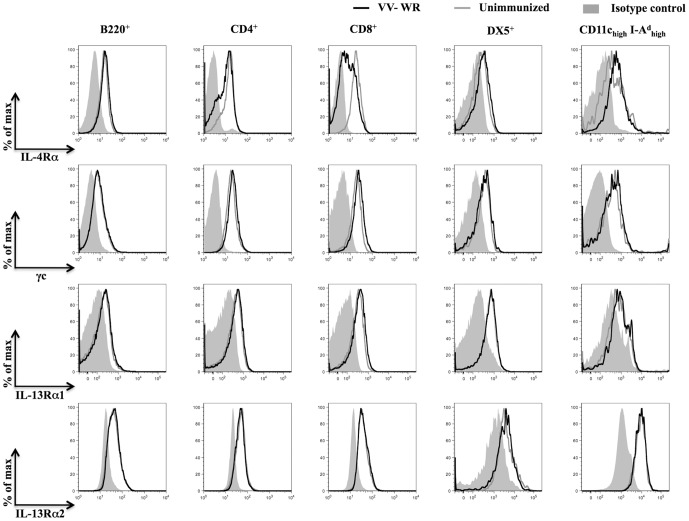
Figure 1. Distribution of IL-4Rα, γc, IL-13Rα1 and IL-13Rα2 on immune cells following VV infection.
BALB/c WT mice (n = 12) infected for 7 days with VV-WR or unimmunized were sacrificed and splenocytes harvested for analysis using flow cytometry. The histogram plots show cell surface expression of IL-4Rα, γc, IL-13Rα1 and intracellular expression of IL-13Rα2 on gated B220+, CD4+, CD8+, DX5+, and CD11chigh I-Ad high splenocytes from a representative VV-WR infected mouse (black lines) and an unimmunized mouse (grey lines). The plots are representative of at least 12 mice tested in at least three independent experiments.

