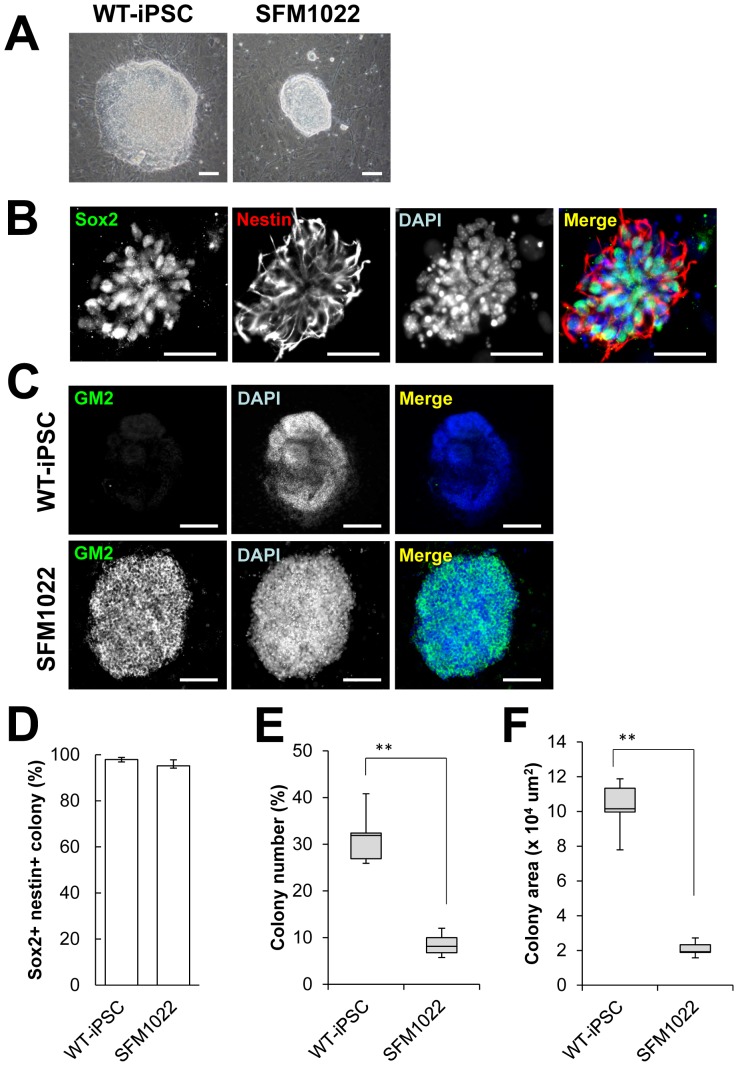
Figure 3. Characterization of SDIA-induced colonies at day 7 of differentiation.
A, Phase-contrast image of SFM1022 and WT-iPSC colonies. B, Immunostaining for Sox2 (green) and nestin (red). C, Immunostaining for GM2 (green). Blue represents DAPI staining. Scale bar indicates 100 µm (A) and 500 µm (B, C). D, The percentages of SFM1022 and WT-iPSC colonies that expressed both Sox2 and nestin were determined. Data are the means ± S.E., and were obtained for five independent experiments. The number (as a function of the initial cell number plated) (E) and sizes (F) of SDIA-induced colonies of larger than 100 µm at day 7 of differentiation were determined. Data were analyzed using the Mann–Whitney U test and are shown as box-and-whisker plots. Boxes, 75th percentile with the median indicated; bars, 10th and 90th percentiles. **P<0.01. Data were obtained for five independent experiments.

