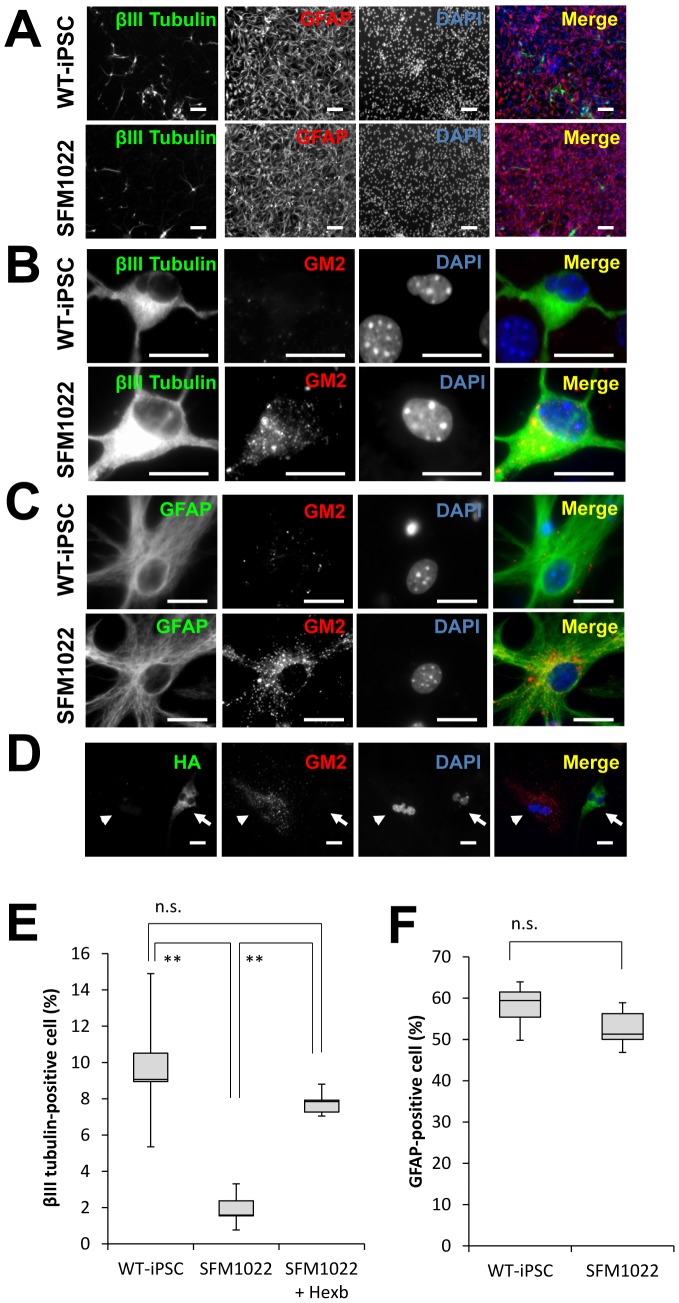
Figure 6. Impairment of neuronal differentiation from NSCs derived from SFM1022 cells.
A–C, Immunostaining of differentiated cells for βIII tubulin (green), GFAP (green), and GM2 (red), with DAPI nuclear staining (blue). Scale bar indicates 100 µm (A) and 20 µm (B, C). D, Immunostaining of HA (green) and GM2 (red) in cells differentiated from SFM1022-derived NSCs transfected with HA-tagged Hexb cDNA. Arrows and arrowheads indicate HA-positive and -negative cells, respectively. Scale bar indicates 100 µm. E, After selection of transiently transfected cells with G418, the selected cells were allowed to differentiate toward a neural lineage. The percentages of neurons that differentiated from the NSCs of passage 1 neurospheres derived from WT-iPSCs, SFM1022, and transfected SFM1022 cells were determined. F, The percentages of astrocytes that differentiated from the NSCs of passage 1 neurospheres derived from WT-iPSCs and SFM1022 cells were determined. Data were analyzed using the Mann–Whitney U test and are shown as box-and-whisker plots. Boxes, 75th percentile with the median indicated; bars, 10th and 90th percentiles. **P<0.01. n.s.: Difference not significant (P>0.05). Data were obtained for five independent experiments.

