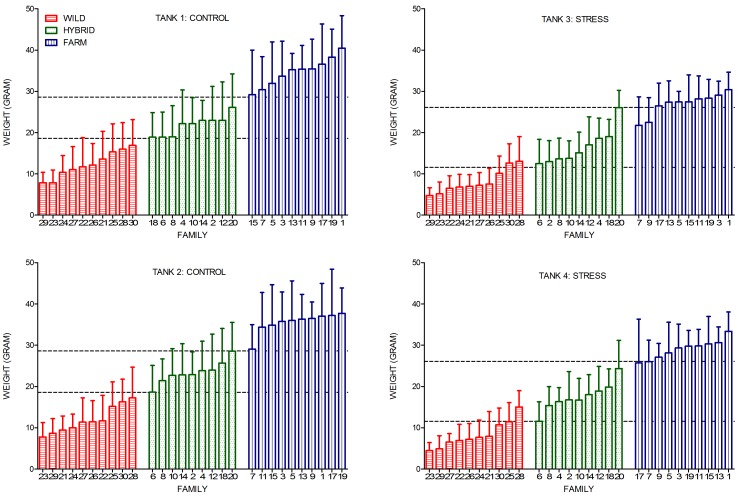
Figure 2. Mean family weight.
Mean family weight (g) of wild, hybrid and farmed families in all four tanks. Farmed families were larger than wild families, while hybrid families were displayed at an intermediate range. All groups grew better in the control treatment, than in the stress treatment. In the control treatment there was no overlap in the weight range of families of farmed, hybrid and wild origin. Lines represent the mean of the smallest and largest hybrid family within each treatment. Error bars show the standard deviation.

