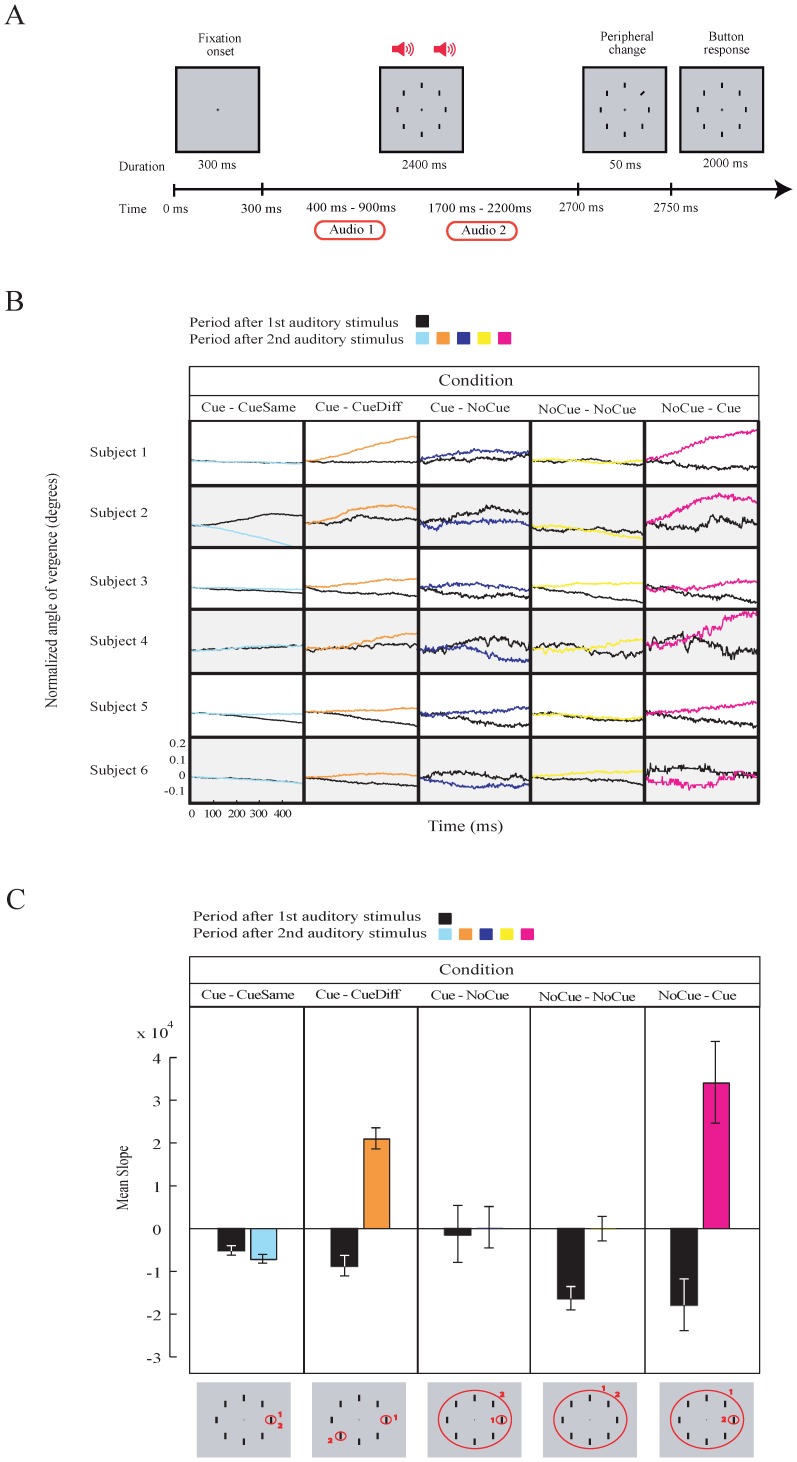
Figure 4. Visual search task combined with auditory cues.
(Experiment 3) and modulation in eye vergence. A. Illustration of the auditory task. Symbols denote cue. Two consecutive cues are given to the subjects B. Average size of AoEV after the onset of the 1st (black traces) and 2nd (colored traces) auditory cue for individual subjects. C. Comparison between the slopes of the modulation (taken from windows in B) of AoEV after the 1st and 2nd auditory cue. Grey panels below illustrate the shift in visuospatial attention (red circles) for each condition. Small circles indicate focused attention to a single target while a large circle indicates global or more spread attention to all possible target location. Numbers indicate the size and position of the attention window after the 1st (1) and 2nd (2) cue. Error bars are SEM.

