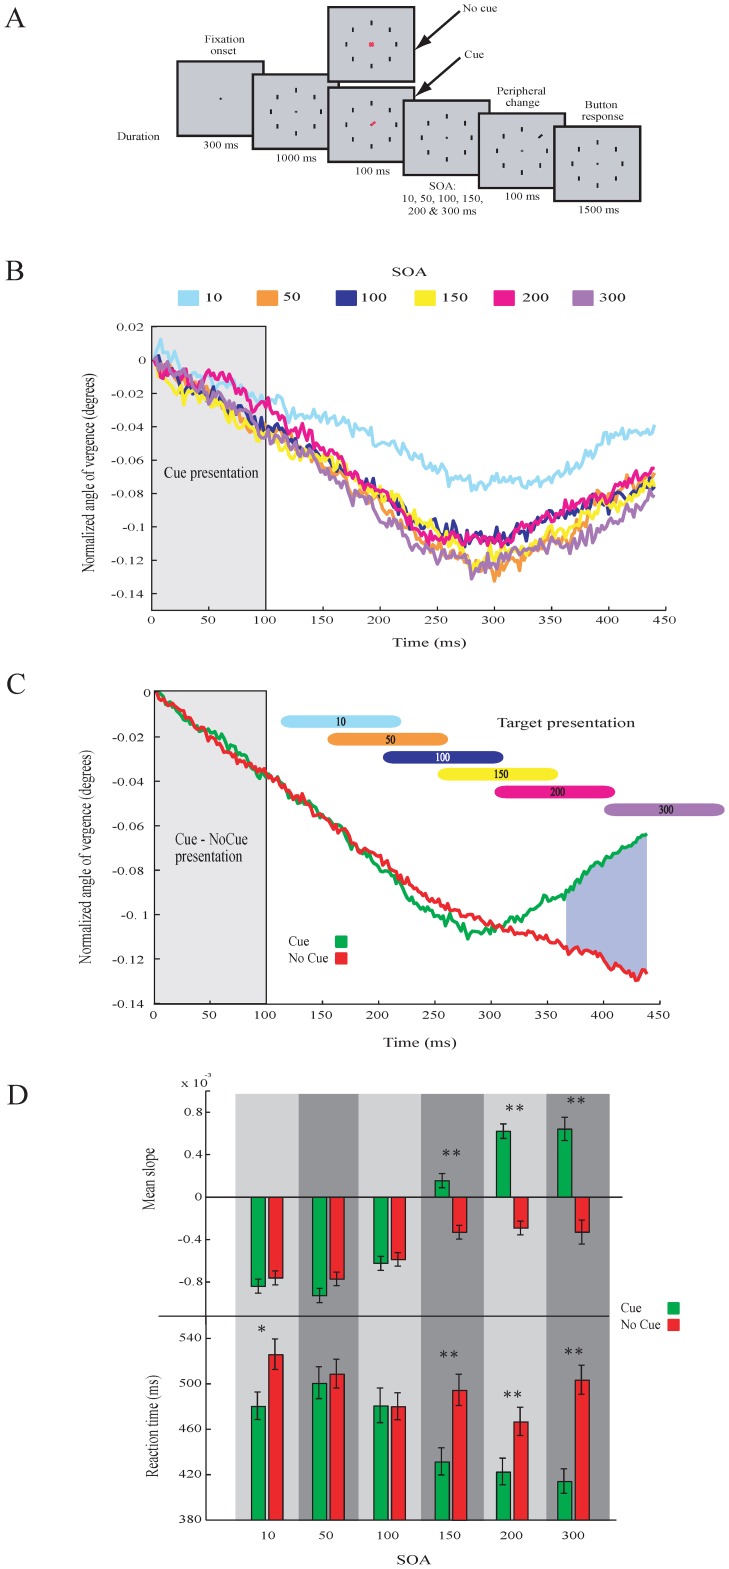
Figure 5. Visual search task.
(Experiment 4) with different SOA and modulation in eye vergcence. A. Illustration of the task. B. Average modulation across all subjects in AoEV separately for the different conditions (SOA). C. Average modulation in AoEV across all conditions. Colored vertical bars indicate the window of target presentation. Blue shaded area denotes a significant (p<0.01) difference between the cue and no-cue condition. D. Slopes of the modulation of AoEV and mean reaction times for the cue and no-cue of the different conditions (SOA). Bars represent the mean slopes, calculated for each condition (windows of 100 ms after target onset). Asterisks denote significant (* = p<0.05, ** = p<0.01, t-test) differences. Error bars are SEM.

