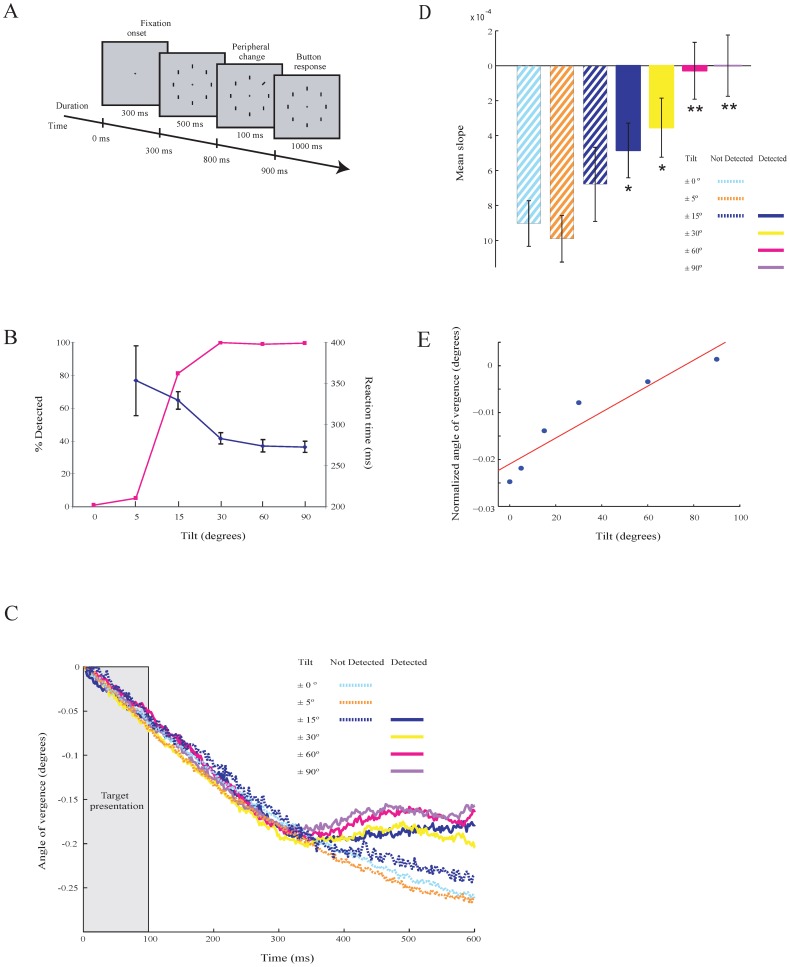
Figure 6. Detection task.
(Experiment 5) and responses. A. Illustration of the task. B. Detection performance (red) and reaction times (blue). Error bars are SEM. C. Modulation in AoEV of one subject separately for the different conditions (tilt) and behaviors (detected and undetected). D. Slopes of the modulation of the AoEV for the different conditions and behaviors. Asterisks denote significant (* = p<0.05, ** = p<0.01) differences (compared to condition 00). Error bars are SEM. E. Mean vergence angle of selected window from all conditions plotted as a function of stimulus contrast. A linear regression line (red) is fitted.

