
Figure 6. Accumulation of α-toxin in whole cell extracts of HeLa cells treated with S. aureus MVs.
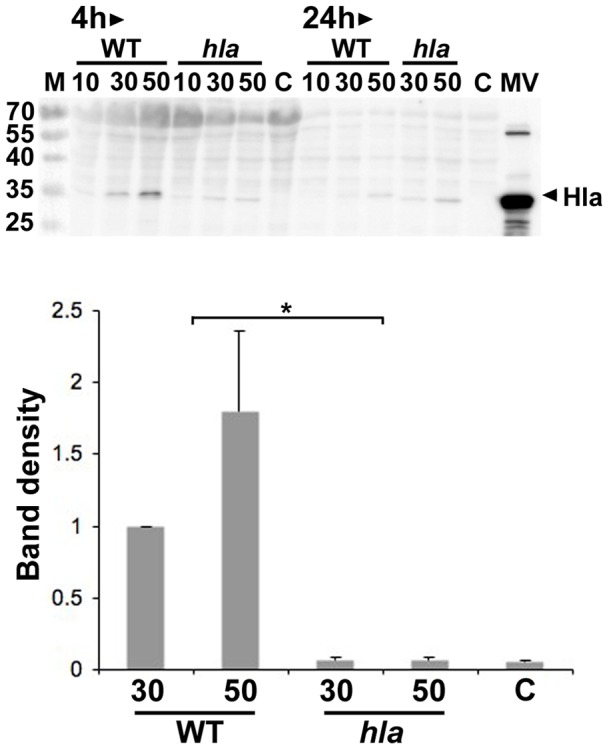
Immunoblot detection using a polyclonal antiserum specific for S. aureus α-toxin. HeLa cells were incubated 4 h and 24 h with MVs obtained from strain 8325-4 (WT), and DU1090 (hla) (10, 30, and 50 µg/ml protein as indicated). Whole cell extract samples equivalent to approximately 8,000 lysed HeLa cells were loaded on the gel. Control treatment = HeLa cells treated with PBS instead of MVs (C). An MV preparation sample from strain 8325-4 (∼10 µg loaded in the lane denoted MV) served as a positive control. The sizes (kDa) of proteins in the prestained molecular weight marker (M) are specified along the left side. Bar graphs indicate results of densitometric analysis of the immunoreactive band corresponding to α-toxin (also indicated by an arrowhead in the figure). Shown are the means ± SEM of relative band density from three independent experiments for treatment of HeLa cells with strain 8325-4 (WT), and DU1090 (hla) MVs (30 and 50 µg/ml protein as indicated) for 24h. Data were normalized to treatment with 8325-4 MVs at a concentration of 30 µg/ml protein. *P<0.04, 8325-4 MVs vs DU1090 MVs for both tested concentrations. The identity of the protein having a slightly smaller molecular size than α-toxin is not known.