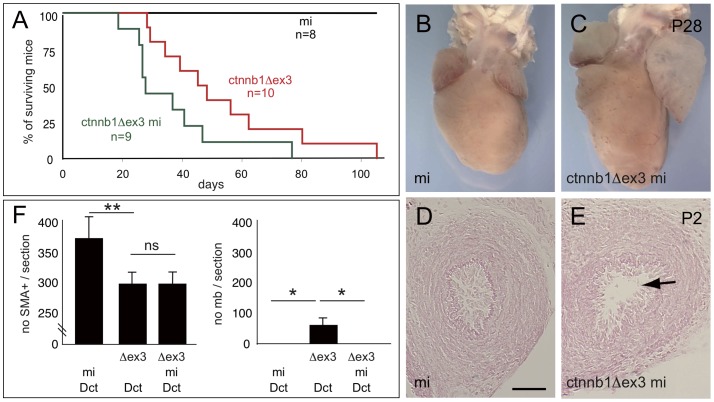
Figure 15. The PDA of ctnnb1Δex3 mice is not rescued by removing melanocytes.
(A) Kaplan-Meier survival graph for ctnnb1Δex3-mi ( = Tyr::Cre/°; ctnnb1Δex3/+; mivga9/mivga9), ctnnb1Δex3 ( = Tyr::Cre/°; ctnnb1Δex3/+; +/+) and mi ( = Tyr::Cre/°; +/+; mivga9/mivga9) littermate controls. There is no significant difference between survival of ctnnb1Δex3-mi and ctnnb1Δex3 populations. Macroscopic view of (B) mi and (C) ctnnb1Δex3-mi hearts at P28. Note the enlargement of the ctnnb1Δex3-mi left atrium (cf. Figure 8). Transverse eosin-stained sections of (D) mi and (E) ctnnb1Δex3-mi DA at P2. Note that the ctnnb1Δex3-mi DA is not closed (cf. Figure 11). (F) Numbers of SMA-positive and LacZ-positive cells were evaluated after SMA, LacZ and DAPI staining in the DA of mi-Dct ( = Tyr::Cre/°; +/+; mivga9/mivga9; Dct::LacZ/°), ctnnb1Δex3-Dct ( = Tyr::Cre/°; ctnnb1Δex3/+; +/+; Dct::LacZ/°) and ctnnb1Δex3-mi-Dct ( = Tyr::Cre/°; ctnnb1Δex3/+; mivga9/mivga9; Dct::LacZ/°) mice at E18.5. For each genotype, the number of cells were estimated from 5–10 sections per embryos using 3 mice. mb = melanoblast. Scale bar (D, E) = 50 µm. *: p-value <0.05, **: p-value <0.01, ns = non significant.

