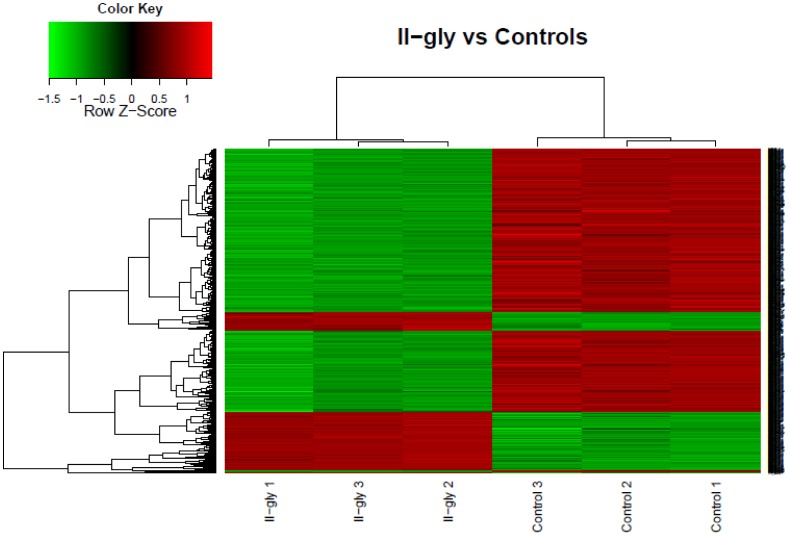
Figure 3. HeatMap for hierarchical clustering of differential gene expression.
HeLa Cells treated with Casiopeína II-gly vs untreated HeLa cells as Controls. We can notice the clear presence of groups of genes that are systematically, either up-regulated (red) or down-regulated (green) in treatment versus controls.

