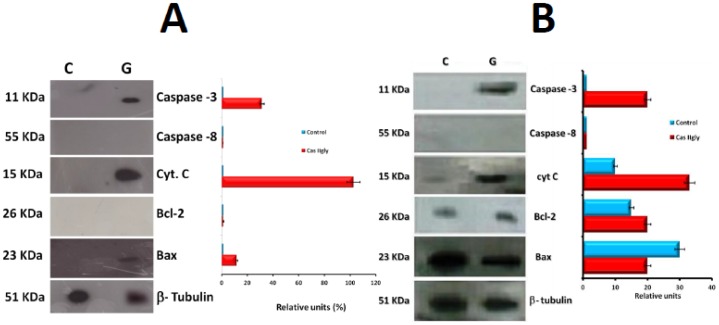
Figure 8. Western Blot for molecules of interest in HeLa and CHP-212.
Cells were previously treated with Cas II-gly at their corresponding IC , C = control cells without treatment, G = Cas II-gly treated cells. Western blot was done in the cytosolic portion after 6 h treatment for HeLa (panel A) and 2 h of treatment for CHP-212 (panel B), in order to detect active caspase-3, caspase-8 cleaved, cyt C, Bcl-2 and Bax. Protein expression was normalized to the
  -tubulin loading control. Each bar represents the mean
  SD (P
SD (P 0.05) from three independent experiments and expressed as Relative units measured by percentage of optical densitometry (% OD).

