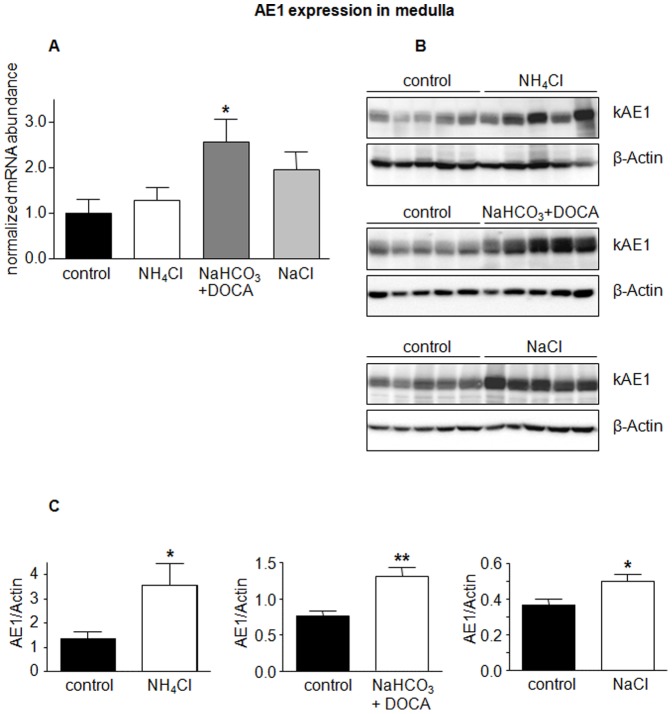
Figure 2. Regulated expression of AE1 in kidney medulla.
mRNA and protein abundance of the type A intercalated cell specific Cl−/HCO3 − exchanger AE1 was measured by real-time RT-PCR (A) and immunoblotting (B) in kidney medulla. (C) Bar graphs summarizing data from immunoblotting. All data were normalized against β-actin obtained on the same immunoblotting membrane after stripping. Data are given as normalized mean ± SE; n = 5–7 animals/group. *p≤0.05, **p≤0.01.

