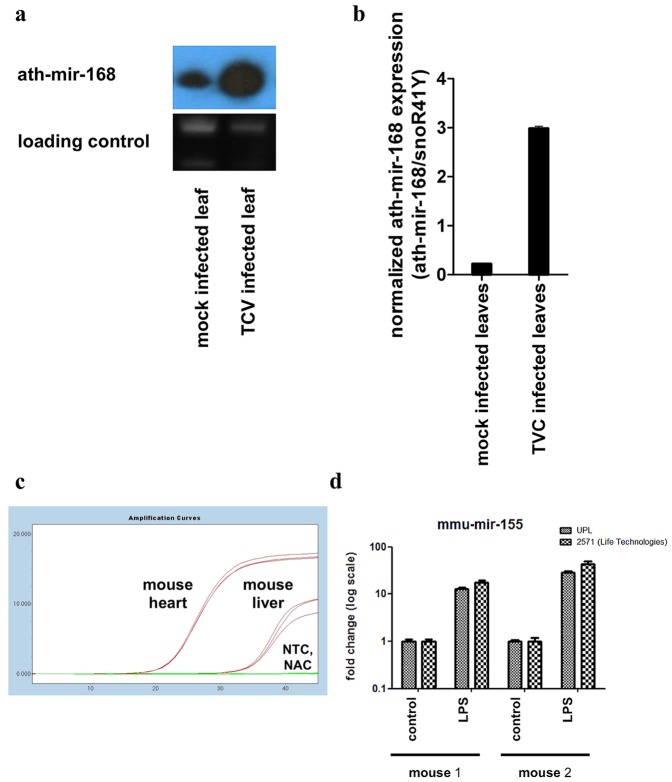
Figure 2. Validation of miRNA specific UPL-based quantitative PCR assays.
Arabidopsis thaliana specific miR168 expression in TCV infected leaves compared to mock control investigated by Northern-blot. As normalizer we used ethidium bromide staining of ribosomal RNA (A) Same samples as in panel “A” were measured with miRNA specific UPL-based quantitative PCR assays. As normalizer we used snoR41Y specific assays. (B). Quantification of LPS induced mir-155 level in mouse macrophages by both UPL-based qPCR system and mature miRNA specific qPCR assays of Life Technologies. As normalizer we used sno202 specific assays. (C).

