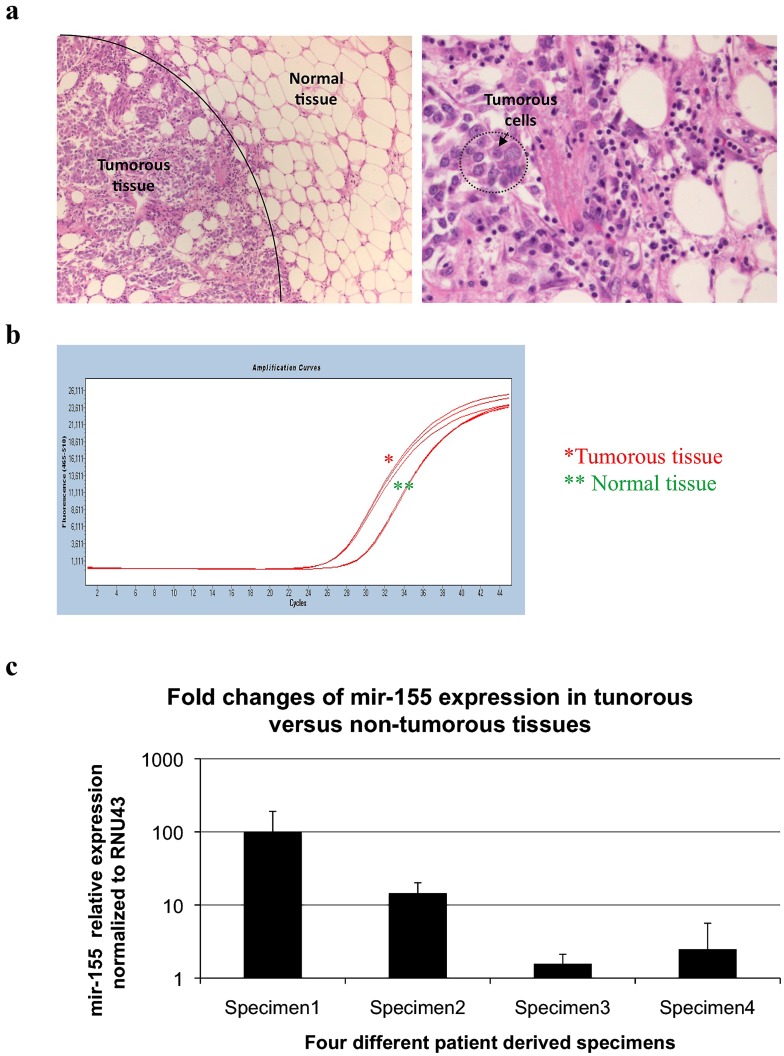
Figure 4. Quantification of miRNA expression from FFPE samples.
Cancerous tissue and surrounding normal tissue obtained from microdissected human FFPE breast cancer sample [invasive duct carcinoma]. Images are showing hematoxylin-eosin stained sections with 10× and 40× original magnifications, respectively (A). Amplification plot of hsa-mir-155 in tumor tissue and normal tissue (B). Fold expression of RNU43 normalized hsa-mir-155 expression in tumor tissues relative to surrounding non-tumorous tissues from four independent breast cancer derived specimens. Error bars represent the standard deviations of the triplicate qPCR measurements (C).

