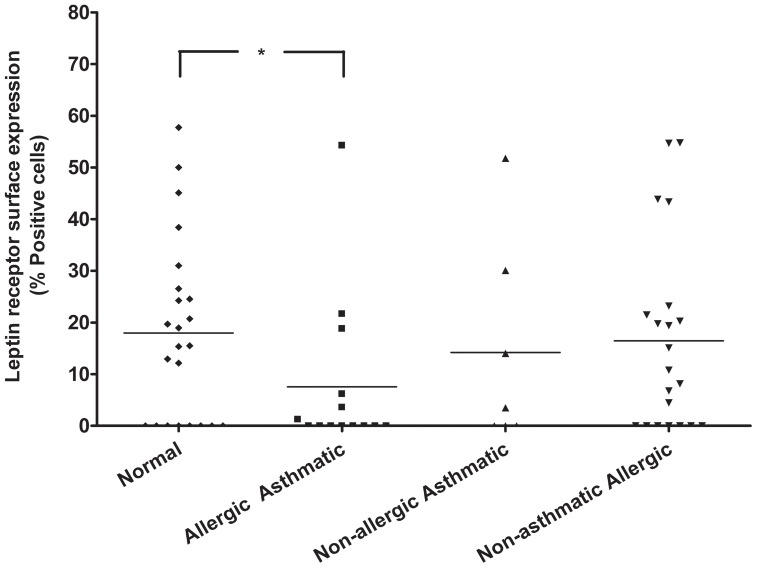
Figure 2. Comparative expression of leptin receptor in neutrophils of different groups of children.
Summary of cumulative leptin receptor expression is shown. X axis represents different groups of children, classified as normal healthy, allergic asthmatic, non-allergic asthmatic, and non-asthmatic allergic children. Y axis shows percentage positive cells compared to isotype control. * p<0.05, unpaired t test.

