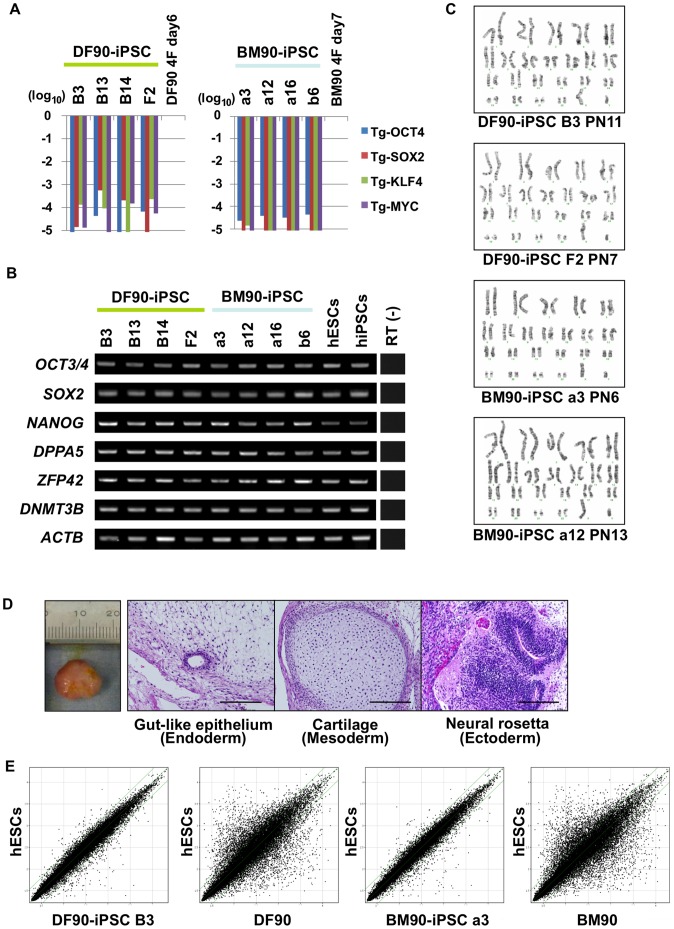
Figure 2. Characterization of iPSCs.
A) Relative expression of retroviral transgenes in DF90 (left panel) and BM90 (right panel)-iPSC clones analyzed by RT-qPCR. The value of each transgene 6 days after infection of DF90 (DF90 4F day 6) and 7 days after infection of BM90 (BM90 4F day 7) was set to 1, and relative values of four transgenes in each clone are shown on a log scale. We selected four clones of which transgene expression was silenced less than 1/1000 compared to the control. B) Expression of ESC-marker genes. Primers used for OCT3/4 and SOX2 detect transcripts from endogenous genes, but not retroviral transgenes. All clones express ESC-marker genes similar to hESCs (KhES3) and hiPSCs (201B7). C) Karyotype analyses. PN, passage number. D) Histological analyses of teratomas derived from iPSCs (DF90-iPSC B3) by hematoxylin and eosin staining. Typical tissue features of each of the three germ layers were found. Scale bar, 200 µm. E) Comparison of global gene-expression patterns between each iPSC clone and hESCs (H9). The two green lines above and below the diagonal green lines indicate the boundary of 2-fold changes between the two samples.

