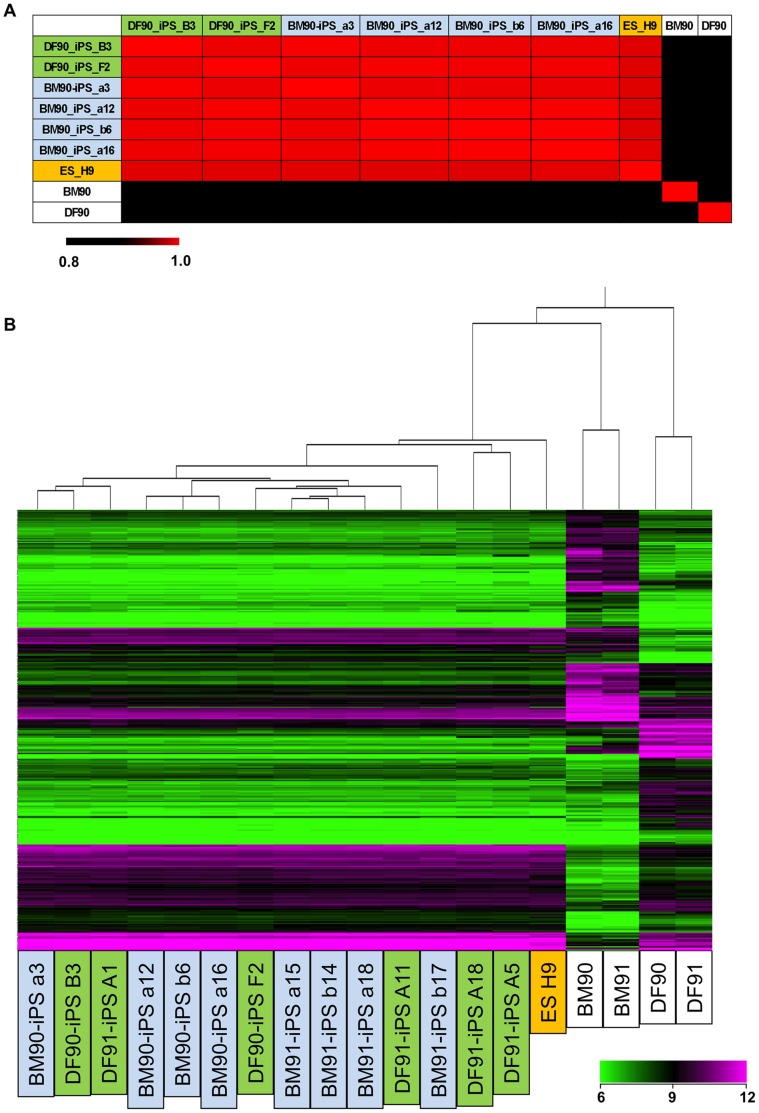
Figure 3. Global gene expression profiles do not differ between BM- and DF-derived iPSCs.
A) Correlation coefficients between each cell were calculated using gene sets differentially expressed in DFs and BMSCs. Differentially expressed genes were defined as genes of which expression varied 2-fold in all pairs, between each BMs and each DFs (9 pairs). Passage number (PN) of cells were as below; BM90 (PN 1), BM 91 (PN 3), BM 94 (PN 2), DF90 (PN 5), DF 91 (PN 5), DF 94 (PN 5), DF90-iPSC B3 (PN 9), F2 (PN 4), BM90-iPSC a3 (PN 4), a12 (PN 4), a16 (PN 4), b6 (PN 4), DF91-iPSC A1 (PN 5), A5 (PN 6), A11 (PN 5), A18 (PN 7), BM91-iPSC a15 (PN 4), a18 (PN 4), b14 (PN 4), b17 (PN 4). B) Hierarchical clustering analysis in iPSC clones and hESC lines (H9) using differentially expressed gene sets in DFs and BMSCs.

