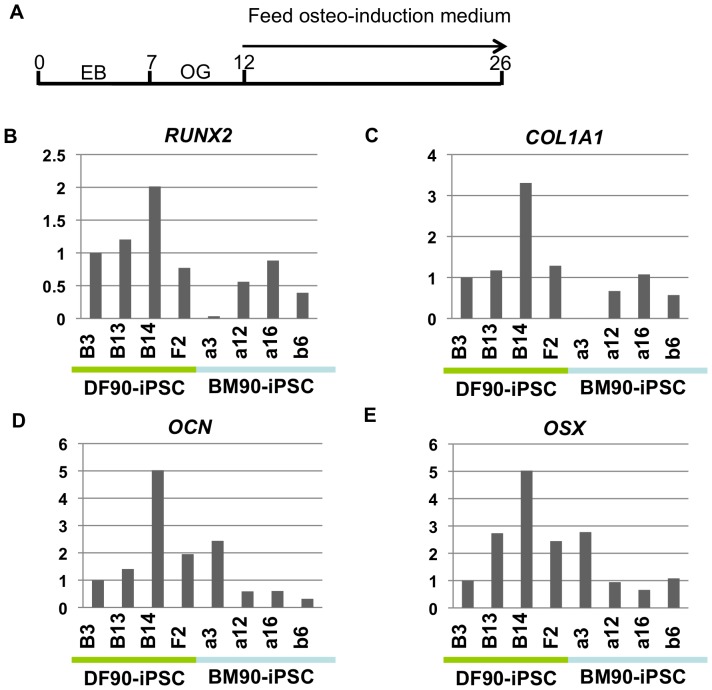
Figure 8. Induction of osteogenic differentiation in iPSCs.
A) Time course of osteogenic differentiation. EB, embryoid body. OG, outgrowth. B-E) Comparison of the relative expression of osteogenesis-related genes (RUNX2, COL1A1, OCN and OSX) by RT-qPCR. The value of DF-iPSC B13 was set to 1 in each experiment.

