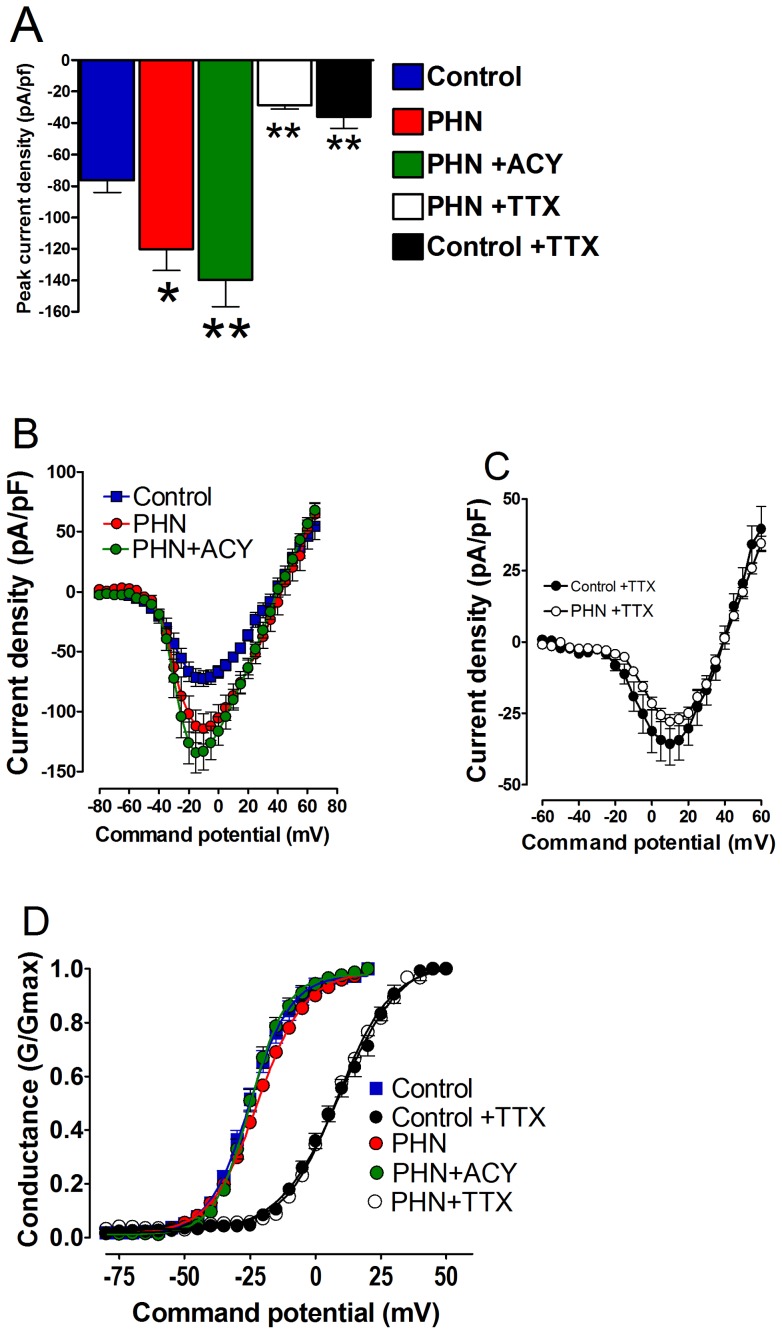
Figure 5. Pre-treatment with acyclovir does not prevent the TTX sensitive increase in sodium current density in ND7/23 1.8 cells induced by prior exposure to VZV isolates implicated in PHN.
(A) Comparison peak current density in sham treated control cells (solid blue bar), cells exposed to VZV isolates implicated in post herpetic neuralgia (PHN, solid red bar), cells exposed to PHN VZV isolates and subsequently treated with acyclovir (solid green bar), the effect of TTX on cells exposed to PHN VZV isolates (open bar) and the effect of TTX on sham treated control cells (solid black bar) (sham treated control vs PHN * = p<0.05; sham treated control vs PHN +ACY ** = p<0.01; PHN vs PHN+TTX ** = p<0.01, and sham treated control vs sham treated control +TTX ** = p<0.01; Analysis of Variance Newman-Keuls multiple comparison post hoc test. (B) and (C) Conventional current density verses membrane potential plots for sodium currents from cells exposed to PHN VZV isolates vaccine strains: sham treated control cells (blue squares) and sham treated control cells following exposure to TTX (black circles); cells exposed to PHN viral isolates in the absence (red circles) and presence of TTX(open circles); and cells exposed to PHN viral isolates that had been pre-treated with acyclovir (green circles). Data was generated using the following protocol: VHold = −120 mV to +100 mV depolarized in 5 mV increments for 25 ms every 1 sec. (D) Data from (B) and (C) represented as conductance plots. Curves were generated and fitted using a standard Boltzman function. The Boltzman curves generated from data set (B) yielded similar maximal activation voltages (V½ control = −23.9±1.6 mV; V½ ACY = −20.9±2.9 mV; V½ PHN = −22.1±2.3 mV) and similarly curves from data set (C) yielded similar half maximal activation voltages (V½ control+TTX = +9.2±1.9 mV; V½ PHN+TTX = 9.5±1.2 mV.

